Site Speed Is a Conversion Tax You Pay at Every Stage

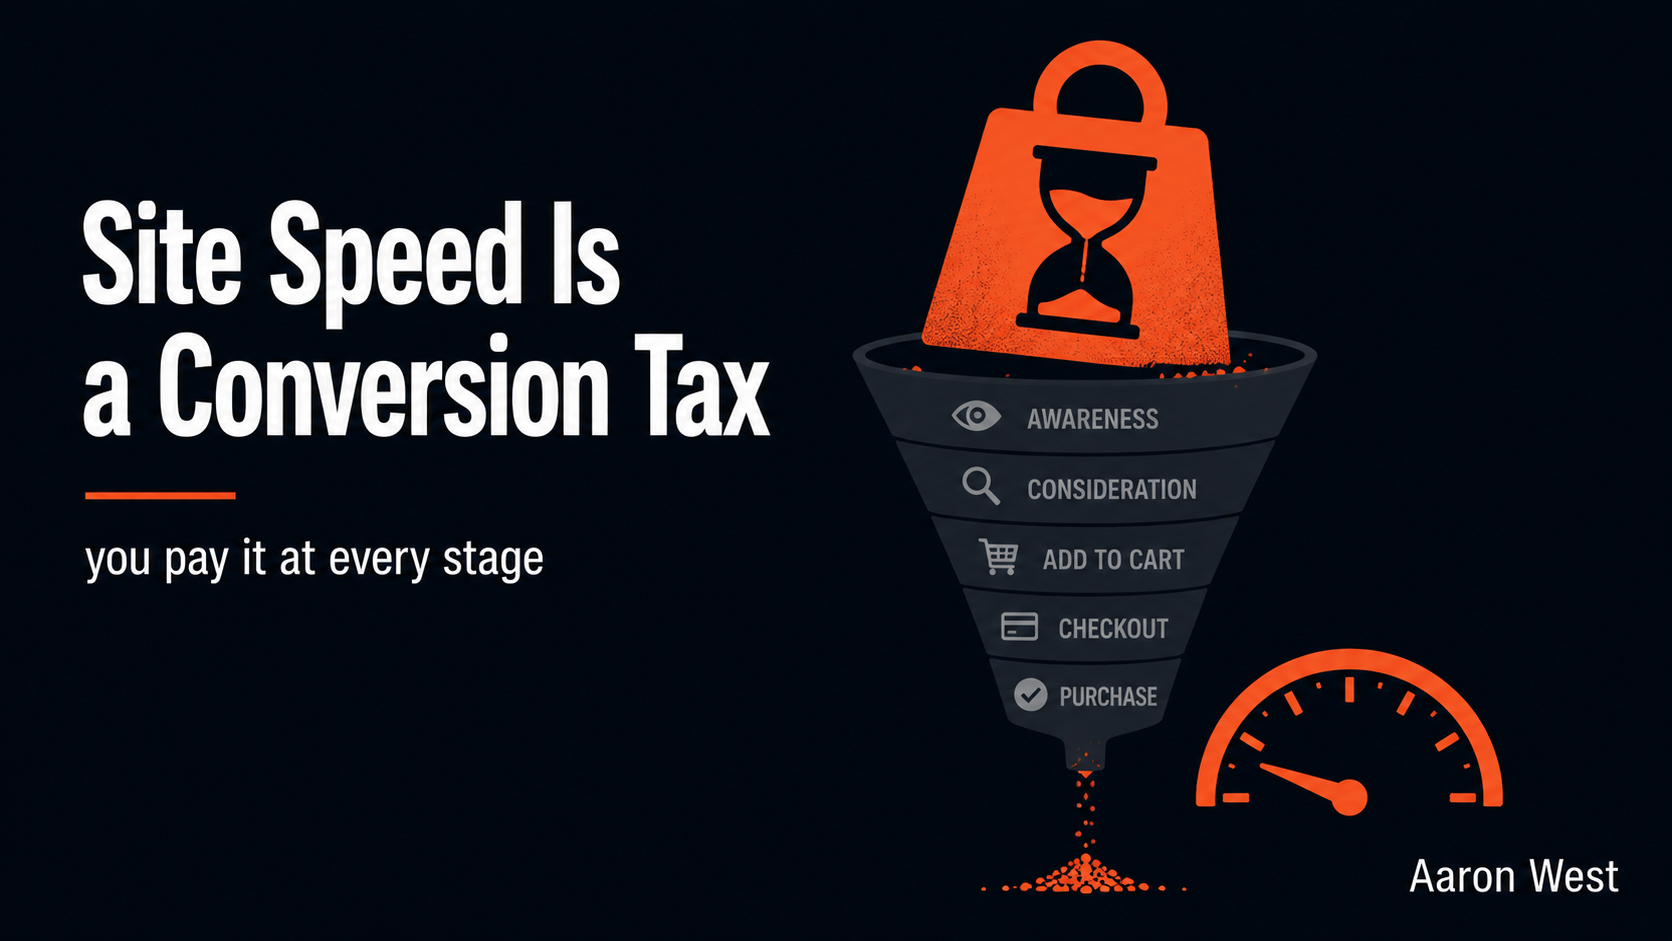
Table of Contents
Site speed is not a separate conversion problem you can deal with later. It is a tax applied to every stage of your funnel at once, quietly shrinking the result of all the other work you do. A slow site loses people at discovery before they have seen a single product, undermines the confidence you carefully built on the product page, and breaks the buying momentum at checkout, all from the same root cause. This is why speed is the most leveraged conversion work there is and also the most neglected: fixing it improves every stage simultaneously, and yet it is invisible to the people who could fix it, because they are testing on a fast office connection and a good laptop, not the mid-range phone on patchy mobile data that a real customer is using.
This is a core piece under my cornerstone on where stores lose the sale, and it connects two halves of my writing that belong together: the conversion and UX side and the AWS and infrastructure side. Speed is exactly where those two meet, because the user-experience problem ("my customers are leaving") and the technical problem ("my pages are heavy and slow") are the same problem viewed from two ends. I will explain why speed taxes every stage, what Google's Core Web Vitals actually measure (in plain terms), the trap of optimising for a score instead of an experience, and the practical order to fix things in. Plain language, no engineering degree required.
Why speed taxes every stage at once
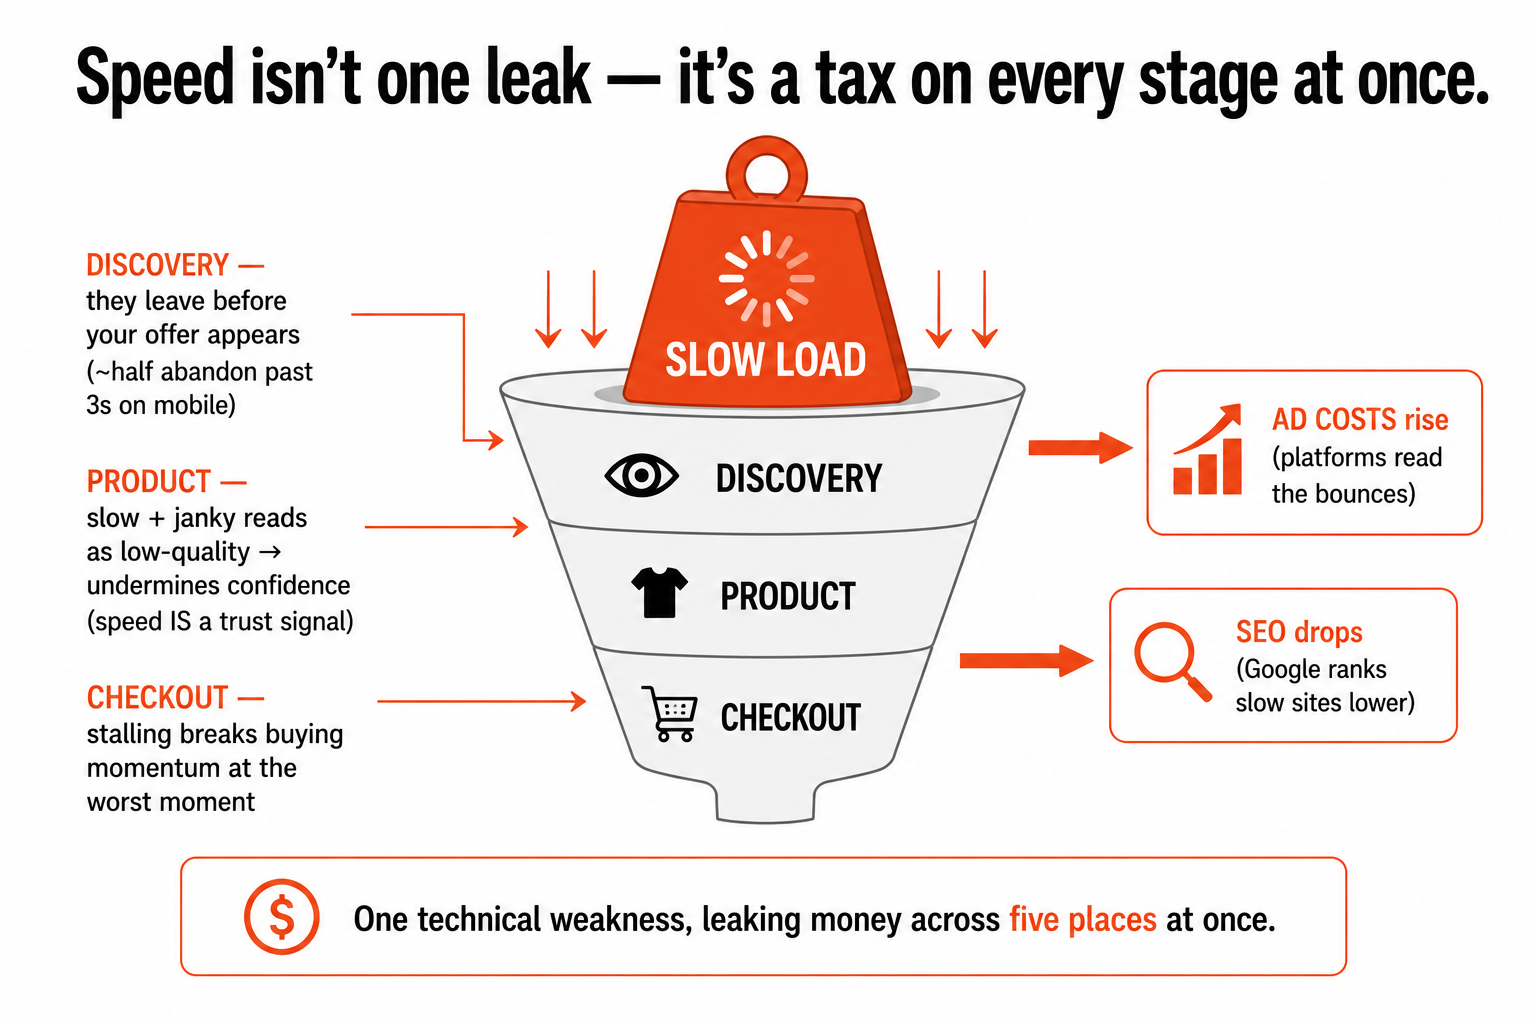
The reason speed matters more than most single conversion fixes is that it does not sit at one point in the funnel, it sits under all of them. Think about what a slow load does at each stage. At discovery, a person who clicked through from an ad or a search result is met with a blank or half-loaded screen, and a large share of them simply leave before anything appears, you lost them before they saw your offer, which is the most wasteful loss possible because you paid to bring them and they never even arrived. The pattern here is brutal and well established: as load time climbs, the share of people who give up climbs with it, and on mobile especially, where a great deal of shopping now happens, roughly half of visitors abandon a site that takes more than about three seconds to load. Three seconds. That is the patience budget, and a lot of stores blow straight through it.
Then it compounds. The work I described in the product-page piece, answering every doubt, building confidence, is undercut if the page loads sluggishly, because a slow, janky page reads as a low-quality, less-trustworthy store before the customer has consciously judged the content. Speed is a trust signal, whether you intend it or not. And at checkout, where you have a person who already decided to buy, a slow or stalling payment step breaks their momentum at the single worst moment, introducing doubt exactly where you most need confidence. The same half-second of delay is taxing your discovery, your product confidence, and your checkout completion all at once.
It does not even stop at conversion. A slow site that people bounce off feeds bad signals to the ad platforms, which, as I argued in the paid-social piece, read those quick exits and deprioritise you, so speed quietly raises your ad costs too. And Google uses real-world speed as a ranking factor, so a slow site is harder to find in the first place. One technical weakness, leaking money at discovery, product, checkout, ad efficiency, and search visibility simultaneously. That is what makes speed uniquely worth fixing: almost nothing else in conversion work pays back across so many stages from a single fix.
What Core Web Vitals actually measure
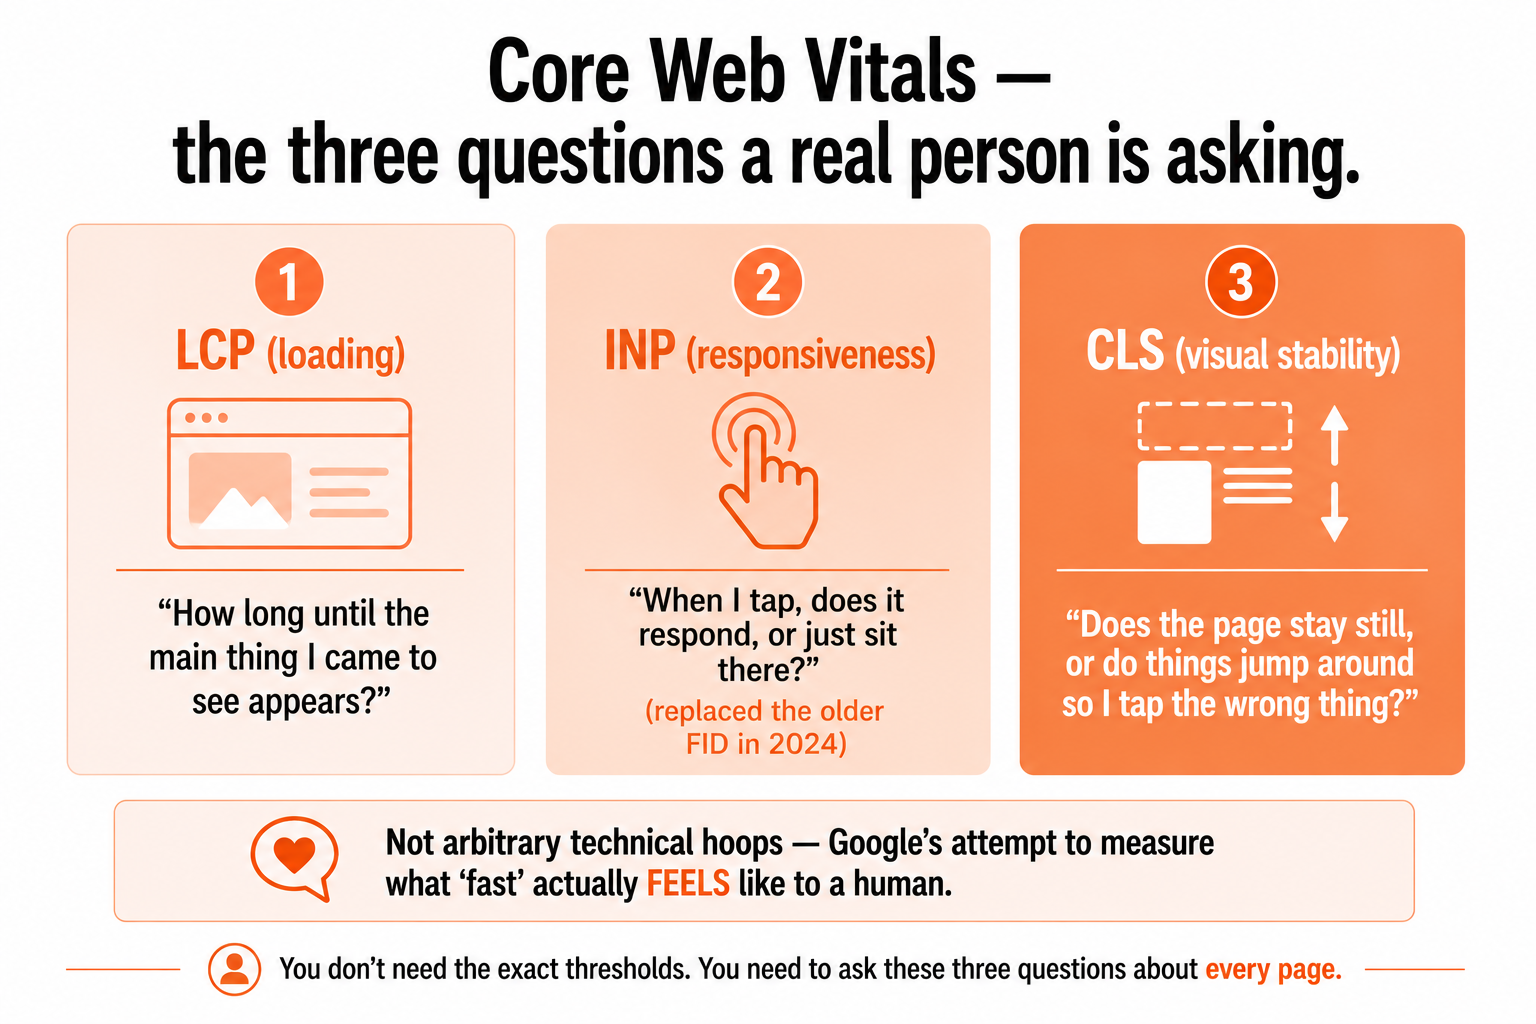
Google bundles the speed that matters into three real-world measures called Core Web Vitals, and they are worth understanding in plain terms because they describe the experience a real person has, not an abstract score. There are three, and each answers a simple human question:
- Largest Contentful Paint (LCP) answers "how long until the main thing I came to see actually appears?" It measures loading, specifically when the biggest, most important piece of content (usually the main image or headline) becomes visible. If this is slow, people stare at a blank or half-built page and leave.
- Interaction to Next Paint (INP) answers "when I tap or click, does the page respond, or does it just sit there?" It measures responsiveness. A page can look loaded but feel dead, you tap "add to cart" and nothing happens for a beat, and that lag feels broken even when it is technically working. (This metric replaced an older one called First Input Delay in 2024, if you see FID referenced in older guides, INP is its more accurate successor.)
- Cumulative Layout Shift (CLS) answers "does the page stay still, or do things jump around as it loads?" It measures visual stability. You have felt bad CLS: you go to tap a button, an image loads above it, everything shifts down, and you tap the wrong thing. Infuriating, and a real cause of misclicks and abandonment, especially on mobile.
Together those three, how fast the main content loads, how quickly it responds, and whether it holds still, are a good plain-language description of what "fast" actually feels like to a human. They are not arbitrary technical hoops; they are Google's attempt to measure the felt experience, which is why they correlate with whether people stay and buy. You do not need to obsess over the exact thresholds, but you should know these three questions, because they are the right questions to ask about any page.
The trap, and the order to fix things in
Here is the mistake I see technically-minded teams make, and it comes straight from my usability background: they optimise for the score instead of the experience. You can chase a perfect performance grade in a testing tool, hit 100 out of 100 on your fast laptop over office wifi, and still have customers bouncing, because that lab score is measured under ideal conditions you do not actually ship to. Your real customers are on a three-year-old mid-range phone, on a patchy mobile connection, on a train. The number that matters is not your lab score, it is what real users actually experience in the field, which is why Google's own data is gathered from real visits, not from a perfect test rig. Test on a cheap phone with the network throttled and you will see what your customers see, and it is usually a sobering distance from your tidy lab number. Measure the experience, not the score.
When it comes to fixing it, there is a reliable order of culprits, and you can work through it without being an engineer. Images are almost always the biggest single weight on an e-commerce page, because product photos are heavy and stores routinely ship them far larger than they need to be, this is the most common and most fixable cause of slowness, and I wrote about it specifically in why your product images slow your conversion rate. Compress them, size them correctly for where they appear, and use modern formats, and most stores get a large speed win from that alone. Second is code bloat: the pile of apps, plugins, tracking scripts, and third-party widgets that each add weight and slow everything down, every one of which should justify its place exactly like a checkout field should. Third is delivery, how physically far your files travel to reach the customer, which is what a CDN solves by serving from a location near the user instead of from one distant server. This blog runs on exactly that setup, a static site served through a content delivery network, which is why it loads fast from anywhere, and I wrote up the whole stack for anyone who wants the technical version.
That order, images first, then code, then delivery, fixes the great majority of speed problems for most stores, and none of it requires deep engineering, just the discipline to measure real conditions and cut weight ruthlessly. The payoff is the thing that makes speed the best-value work in conversion: because it taxes every stage, fixing it once lifts discovery, product confidence, checkout completion, ad efficiency, and search visibility together, and unlike most conversion work, it stays fixed. It is the rare improvement you make once and benefit from on every visit, on every page, forever. Most stores never get to it because it is invisible from the inside, everything feels fast on the office connection. Pick up a cheap phone, throttle the network, and load your own store the way a real customer does. What you see will usually tell you exactly why you are losing people you never knew you had.
A few common questions
How much does site speed affect conversions? A lot, and across the whole funnel rather than at one point. The relationship is well documented: as load time climbs, the share of people who give up climbs with it, and even a single extra second measurably reduces conversions. It's most severe on mobile, where roughly half of visitors abandon a site that takes more than about three seconds to load. The reason the impact is so large is that speed isn't a single-stage problem, a slow site loses people at discovery, undermines product-page confidence, and breaks checkout momentum simultaneously, so a small delay is taxing every stage at once.
What are Core Web Vitals in plain terms? Google's three real-world measures of what "fast" actually feels like. Largest Contentful Paint (LCP) is how long until the main content you came to see appears, it measures loading. Interaction to Next Paint (INP) is whether the page responds when you tap it or just sits there, it measures responsiveness (it replaced an older metric called First Input Delay in 2024). Cumulative Layout Shift (CLS) is whether the page stays still or things jump around as it loads, causing you to tap the wrong thing, it measures visual stability. Together they describe how fast a page feels to a real human, which is why they correlate with whether people stay and buy.
Why does my site score well in tests but still feel slow to customers? Because lab scores are measured under ideal conditions you don't actually ship to. A perfect grade on your fast laptop over office wifi tells you little about a real customer on a mid-range phone on a patchy mobile connection. The number that matters is field data, what real users actually experience, which is why Google gathers its own measurements from real visits rather than a test rig. Test on a cheap phone with the network throttled and you'll see what your customers see, which is usually a sobering distance from your tidy lab score. Optimise for the experience, not the score.
What's the fastest way to speed up an e-commerce site? Work through the culprits in order. Images are almost always the biggest single weight, product photos shipped far larger than needed, so compress them, size them correctly, and use modern formats; most stores get a big win from this alone. Second is code bloat: the pile of apps, plugins, and third-party scripts that each add weight, each should justify its place. Third is delivery, how far your files travel to reach the customer, which a content delivery network solves by serving from a location near them. None of it requires deep engineering, just measuring real conditions and cutting weight ruthlessly.
You should also read:
The Thank-You Page: Where Conversion Ends and Retention Begins
The moment right after someone buys from you is the single highest-trust, highest-goodwill moment you will ever get with that person. They have just said yes. They have handed over their card, their email, their address. Their guard is down and their momentum is forward.
Continue reading...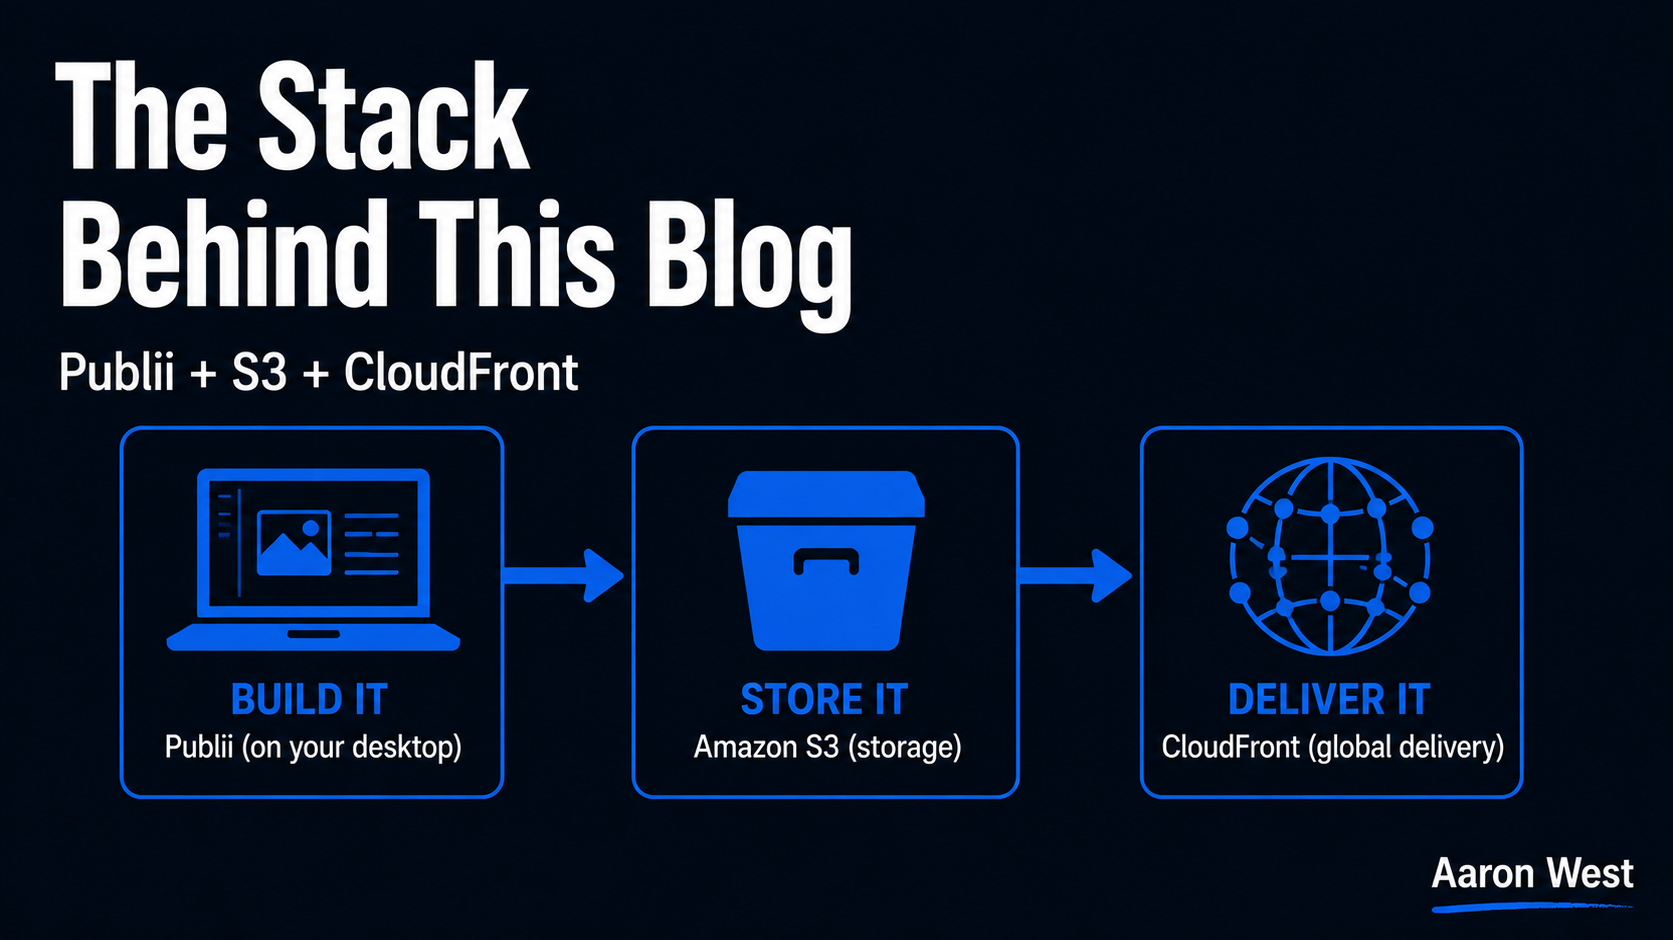
The Static-Site Stack Behind This Blog: Publii, S3, and CloudFront
This blog has no database, no web server running around the clock, and nothing on it that can really be "hacked" in the usual sense. It is a set of plain HTML files, built on my own laptop, stored in AWS, and delivered fast to…
Continue reading...
Why Your Product Images Are Slowing Down Your Conversion Rate
The single biggest thing slowing down your online store is almost certainly the very thing you put there to sell the product: the images. On a typical e-commerce page, images make up more than half of everything the browser has to download, and unoptimised product…
Continue reading...