Conversion Rate, Explained Beyond the Formula

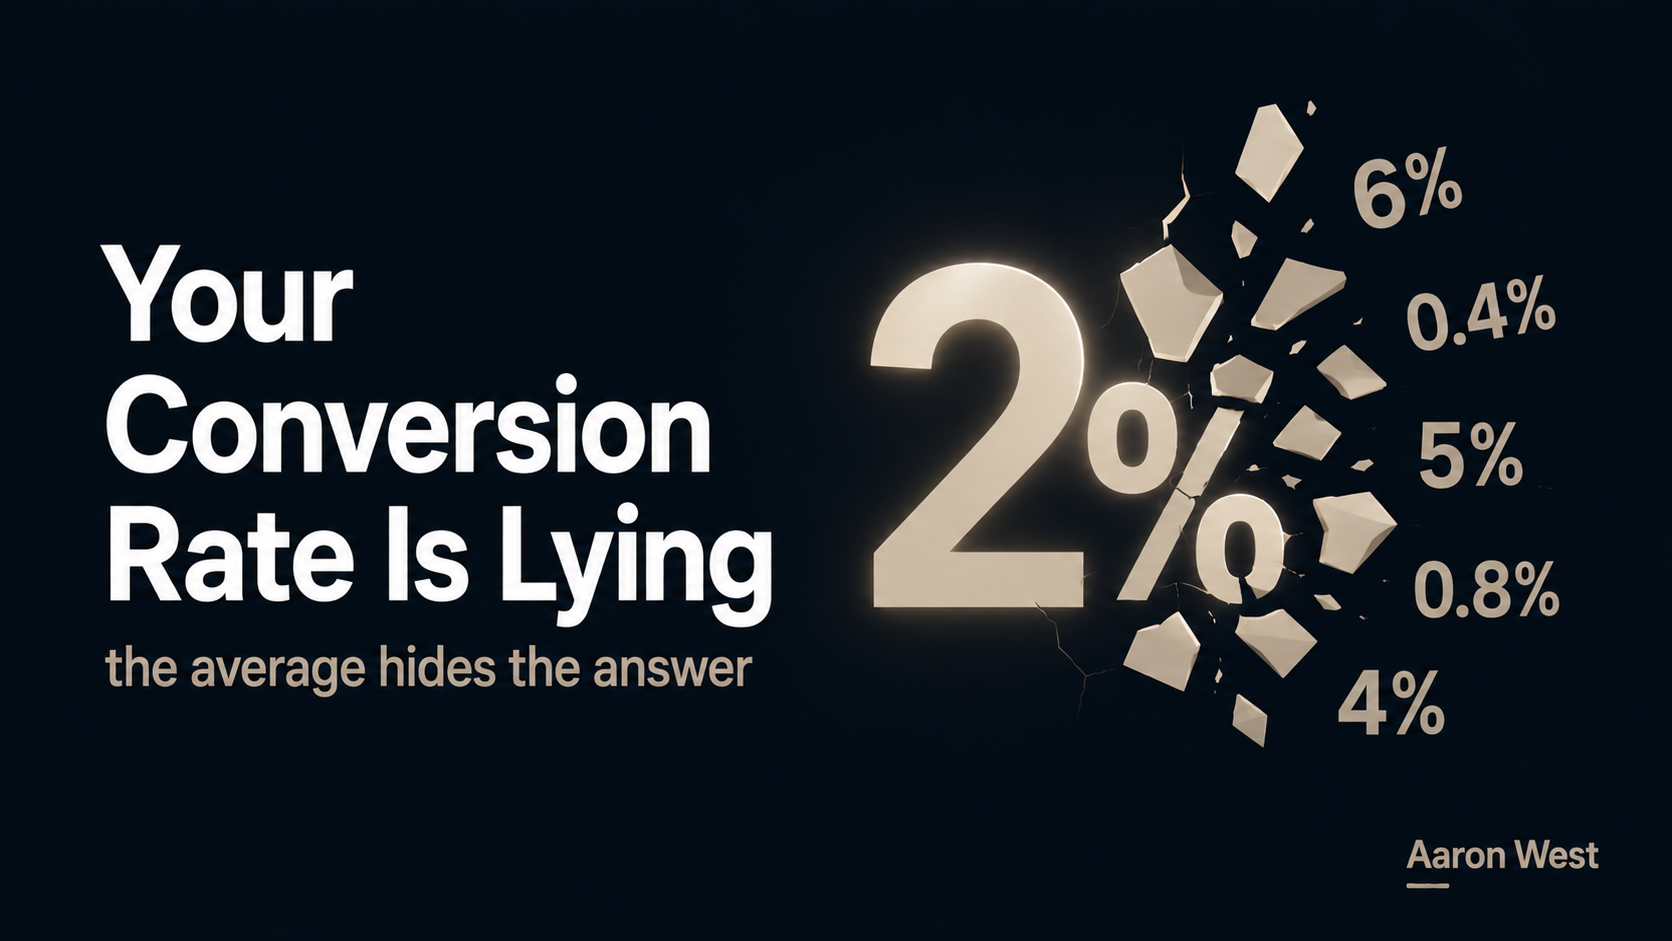
Table of Contents
Conversion rate is the share of visitors who do the thing you wanted, usually buy, and the formula (conversions divided by visitors) is the least interesting thing about it. The number that matters isn't the rate, it's knowing why it's that number and which visitors you're even counting. A "2% conversion rate" means nothing until you know whose 2%, on what traffic, at what step.
This is a reference piece in the E-Commerce Foundations cluster, the spine the rest of the hub links down to. Conversion rate is one of those numbers everyone quotes and few actually read.
The formula is the boring part
Conversion rate = conversions ÷ visitors, expressed as a percentage. If 1,000 people visit and 20 buy, that's a 2% conversion rate. That's the whole formula, and it's where most conversations both start and stop, which is the problem. The formula is arithmetic. The understanding is everything that sits underneath it.
Because a single blended conversion rate is an average, and an average is a story with all the interesting parts removed.
The average is a lie
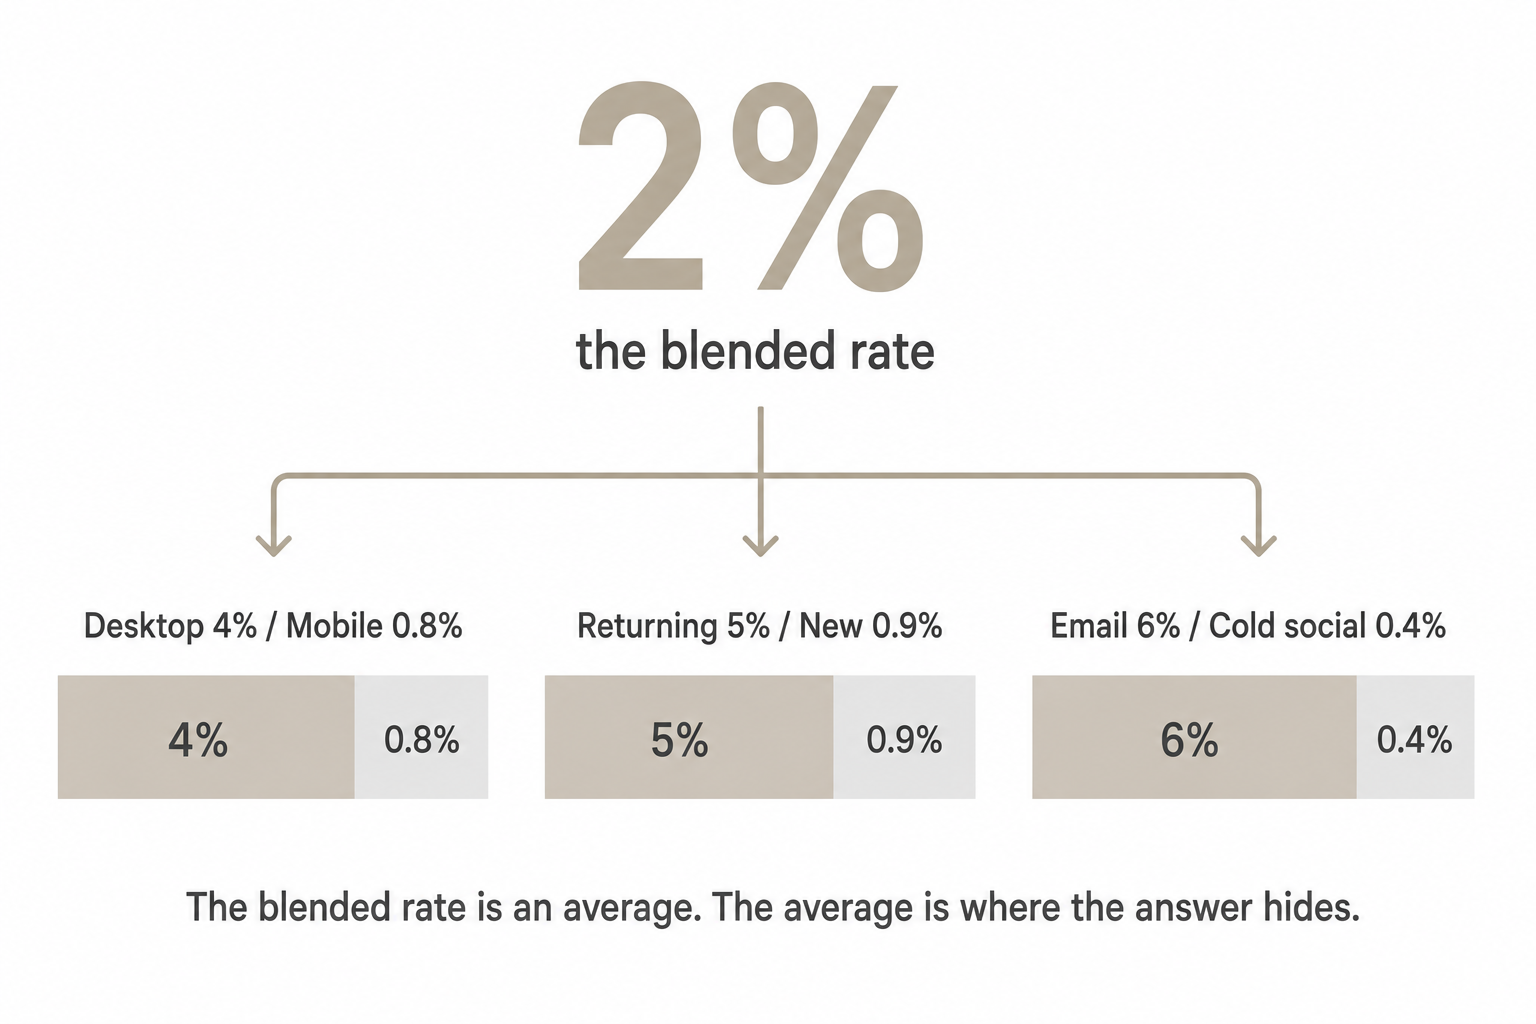
Your "2% conversion rate" is almost never 2% for anyone in particular. Segment it and it falls apart into completely different numbers that demand completely different responses:
- Device: that blended 2% might be 4% on desktop and 0.8% on mobile. If most of your traffic is mobile, you don't have a conversion problem, you have a mobile problem, and optimising the desktop experience is effort spent in the wrong place.
- Source: organic visitors convert differently from paid, which convert differently from email, which convert differently from a cold social audience. Blending them hides which channel is actually working.
- New vs returning: returning customers convert far higher than first-timers. A rate that looks healthy might just mean a lot of loyal repeat buyers masking a store that converts new visitors terribly.
- Step: add-to-cart rate, checkout-start rate, and purchase rate are three different conversion rates. Knowing which step leaks tells you where the problem actually is.
The blended number tells you something is happening. It never tells you what, where, or to whom. The first real skill in reading conversion rate is refusing to look at the blended figure and insisting on the segments underneath.
Which conversion, and which denominator
Two definitional traps make the same number mean different things in different rooms.
Which conversion? "Conversion rate" with no step named is ambiguous. Add-to-cart is a conversion. Reaching checkout is a conversion. Completing the purchase is a conversion. When someone quotes a rate, the first question is always: a conversion to what. Otherwise you're comparing two numbers that measure different things and calling it analysis.
Which denominator? Visitors, sessions, or unique users? The same set of purchases divided by sessions gives a lower rate than divided by unique visitors, because one person can have several sessions. Neither is wrong; they're just different. But compare your session-based rate to someone else's visitor-based rate and you'll draw a confident, false conclusion. Pin down the denominator before you trust the percentage.
The trap: optimising the rate vs optimising the business
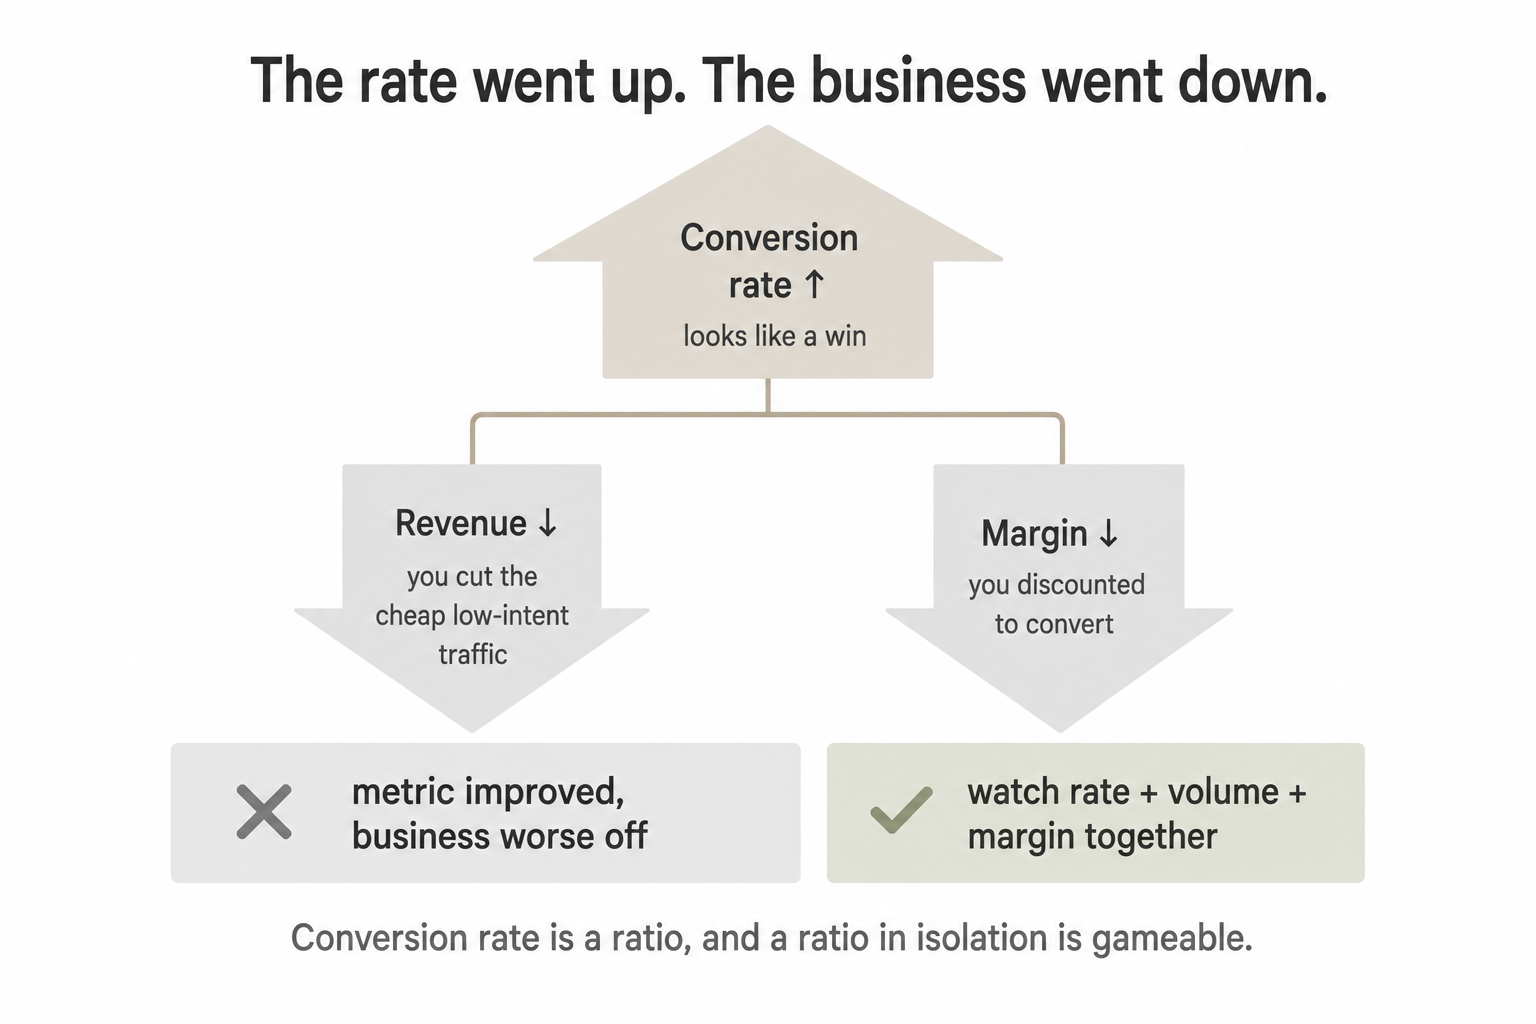
Here's the one that costs real money. Conversion rate is a ratio, and a ratio can improve while the business gets worse.
You can raise your conversion rate by cutting traffic. Drop the cheap, low-intent visitors at the top of the funnel and the rate soars, because you've removed the people who were never going to buy. The percentage looks fantastic. Revenue falls. You optimised the metric and damaged the business.
You can raise it by discounting. Slash prices and more people convert, the rate climbs, and your margin quietly dies. Again, the metric improved and the business is worse off.
This is the same lie that ROAS tells: a ratio in isolation is gameable and misleading. The fix is to never look at conversion rate alone. Watch the rate, the volume, and the margin together. A rate that rises while volume and margin hold is real progress. A rate that rises while volume or margin falls is a metric flattering you on the way down.
What actually moves it (and what doesn't)
Conversion rate doesn't move because of a magic button colour. It moves because of friction removed, intent matched, trust earned, and speed delivered, the unglamorous work that lives in the Conversion & UX and experimentation parts of this hub. Match the page to why the visitor came, remove the steps that make them think, give them reasons to trust you, and make it fast. That's most of it. Everything else is tinkering at the edges of those four.
The benchmark trap
"What's a good conversion rate?" is the wrong question, and the honest answer is "it depends so heavily that the average is useless to you." Conversion rate varies wildly by category, price point, traffic mix, and how you count it. A high-consideration, high-price product converts far lower than an impulse buy, and neither rate tells you anything about the other store's health. Comparing yourself to an industry benchmark is comparing your specific situation to an average of situations that aren't yours.
The only benchmark worth tracking is your own segmented trend over time. Is your mobile-new-visitor purchase rate going up or down. That you can act on. "The industry average is X" you cannot.
What this comes down to
Conversion rate is a thermometer, not a lever. It tells you, roughly, that something is or isn't working. It never tells you what to do, and the moment you treat it as a target to push rather than a signal to read, you start making decisions that improve the number and hurt the business.
So segment it, name the step and the denominator, watch it alongside volume and margin, and stop comparing yourself to benchmarks built from situations that aren't yours. The number is the start of the question, not the answer.
A few common questions
What is a conversion rate, simply? The share of visitors who complete the action you wanted, usually a purchase, calculated as conversions divided by visitors. If 1,000 people visit and 20 buy, that's 2%. The formula is simple arithmetic; the value is in understanding which visitors you're counting and why the number is what it is, not the calculation itself.
Why shouldn't I trust my blended conversion rate? Because it's an average that hides completely different stories. A blended 2% might be 4% on desktop and under 1% on mobile, or healthy only because loyal returning customers mask a store that converts new visitors terribly. The blended number tells you something is happening but never what, where, or to whom. Always segment by device, source, new-versus-returning, and funnel step before drawing any conclusion.
Can a conversion rate improve while the business gets worse? Yes, and it's a common trap. Conversion rate is a ratio, and ratios are gameable. Cut cheap low-intent traffic and the rate soars while revenue falls. Discount heavily and more people convert while margin dies. In both cases the metric improved and the business is worse off. The fix is to never read conversion rate alone, always watch it alongside volume and margin.
What's a good conversion rate? The wrong question. Conversion rate varies so much by category, price point, traffic mix, and how you count it that industry benchmarks are close to useless for any specific store, a high-price considered purchase converts far lower than an impulse buy, and neither rate says anything about the other's health. The only benchmark worth tracking is your own segmented trend over time.
You should also read:
The Affiliate Publisher Landscape: Every Partner Type, Explained
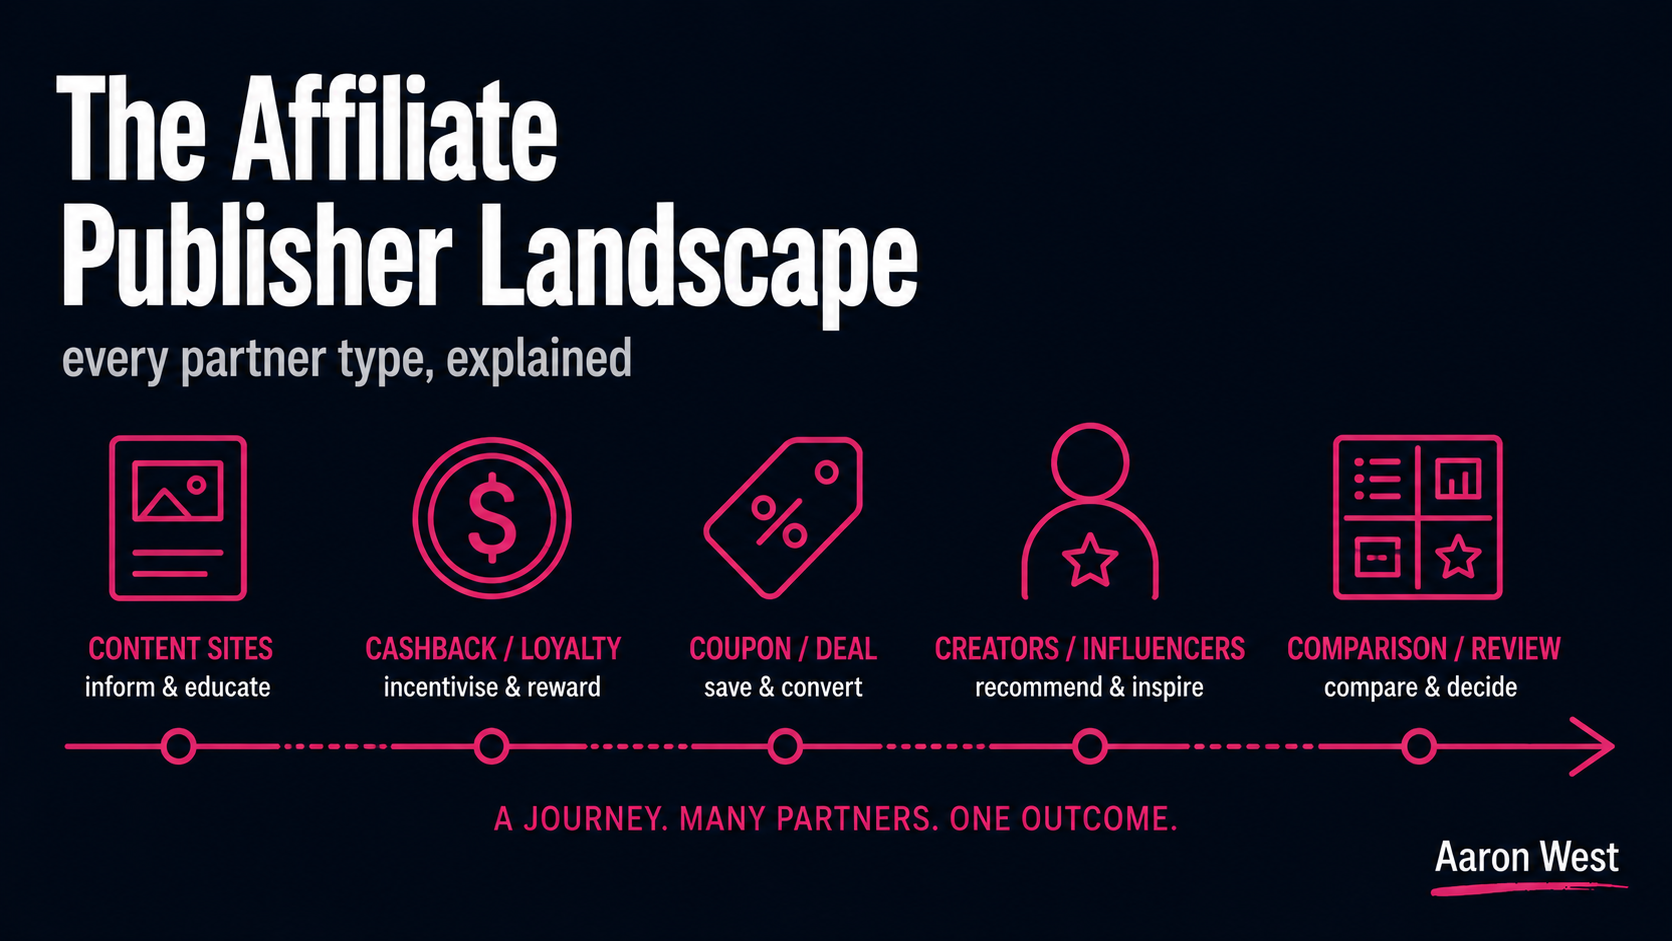
"Affiliate" covers wildly different kinds of partner, content sites, cashback platforms, coupon sites, influencers, comparison engines, and the single most important thing to understand is that they do fundamentally different jobs. Some genuinely introduce new customers to your brand; others mostly intercept customers who were…
Continue reading...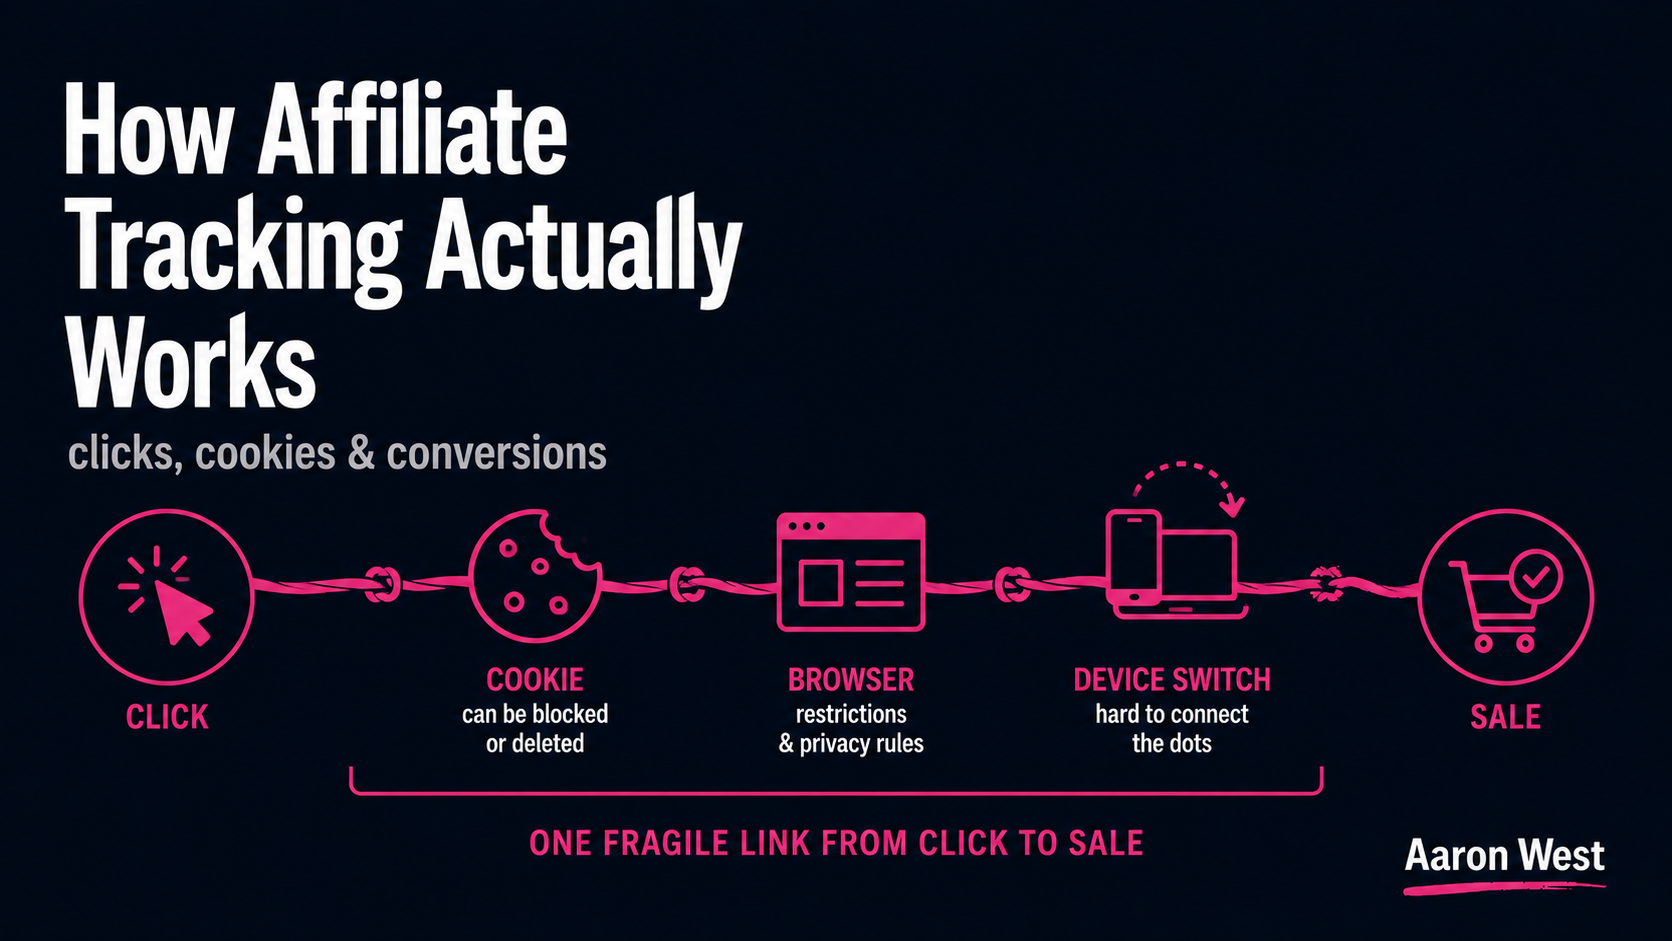
How Affiliate Tracking Actually Works: Clicks, Cookies and Conversions
Affiliate tracking is the machinery that connects a click on a partner's link to a purchase that happens later, so the right partner gets paid, and in 2026 it runs on three core methods: the browser cookie (simple but increasingly unreliable), the tracking pixel (fires…
Continue reading...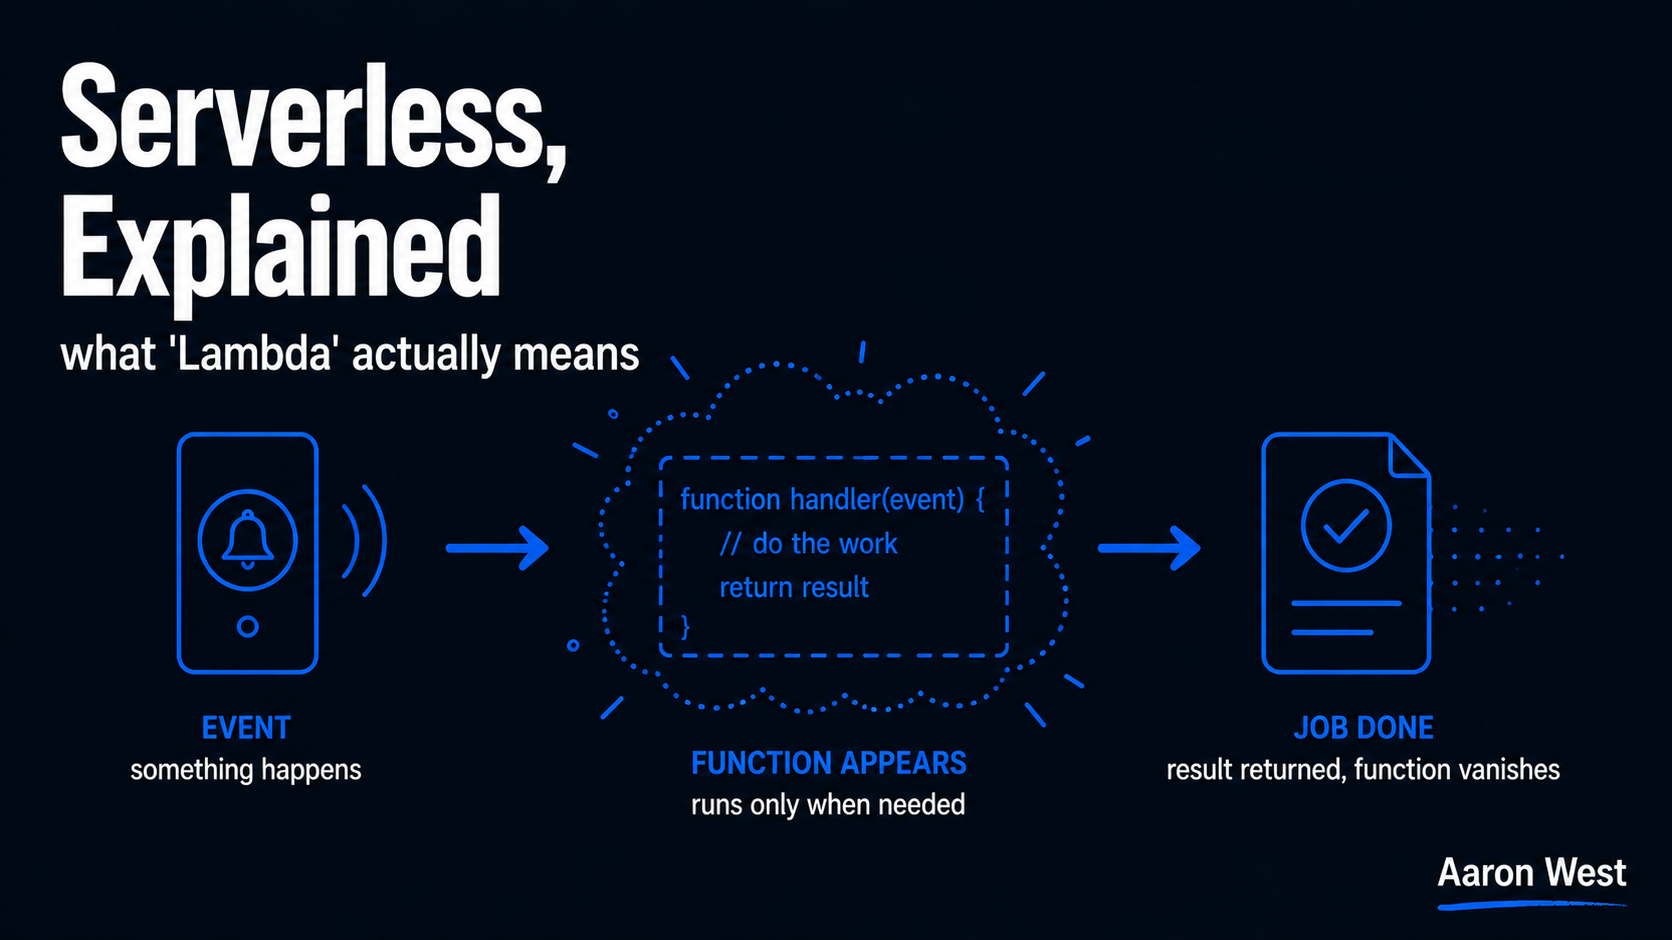
Serverless Explained for a Marketing Team (What "Lambda" Actually Means)
"Serverless" is one of the most misleading words in technology, because it does not mean there are no servers. It means you do not have to think about them. With serverless computing, you hand a small piece of code to a cloud provider, it runs…
Continue reading...