ROAS Is the Metric That Lies: Measure Profit, Not Return on Ad Spend

Table of Contents
A 4x ROAS can be a business quietly losing money on every sale. That is the uncomfortable truth at the centre of performance marketing's favourite metric: return on ad spend measures revenue per advertising euro, not profit, so a campaign can hit an impressive ROAS target while your actual margin bleeds out through the costs ROAS never sees. Most ecommerce stores need something like a 3x to 4x ROAS just to break even once you subtract product cost, shipping, fees, and returns, which means the "great 3.5x" your dashboard is celebrating might be barely covering costs, or losing. ROAS is not useless. But treating it as your scoreboard is one of the most common and expensive mistakes in the discipline.
This is the piece the cornerstone and the metrics glossary both promised, because ROAS deserves its own reckoning. The whole philosophy of performance marketing is knowing what your money actually bought, and ROAS is the metric most likely to lie to you about exactly that. There are two separate ways it lies, and understanding both is what lets you keep using it without being fooled by it. Let me take them one at a time, then get to what to measure instead.
Lie #1: ROAS counts revenue, not profit
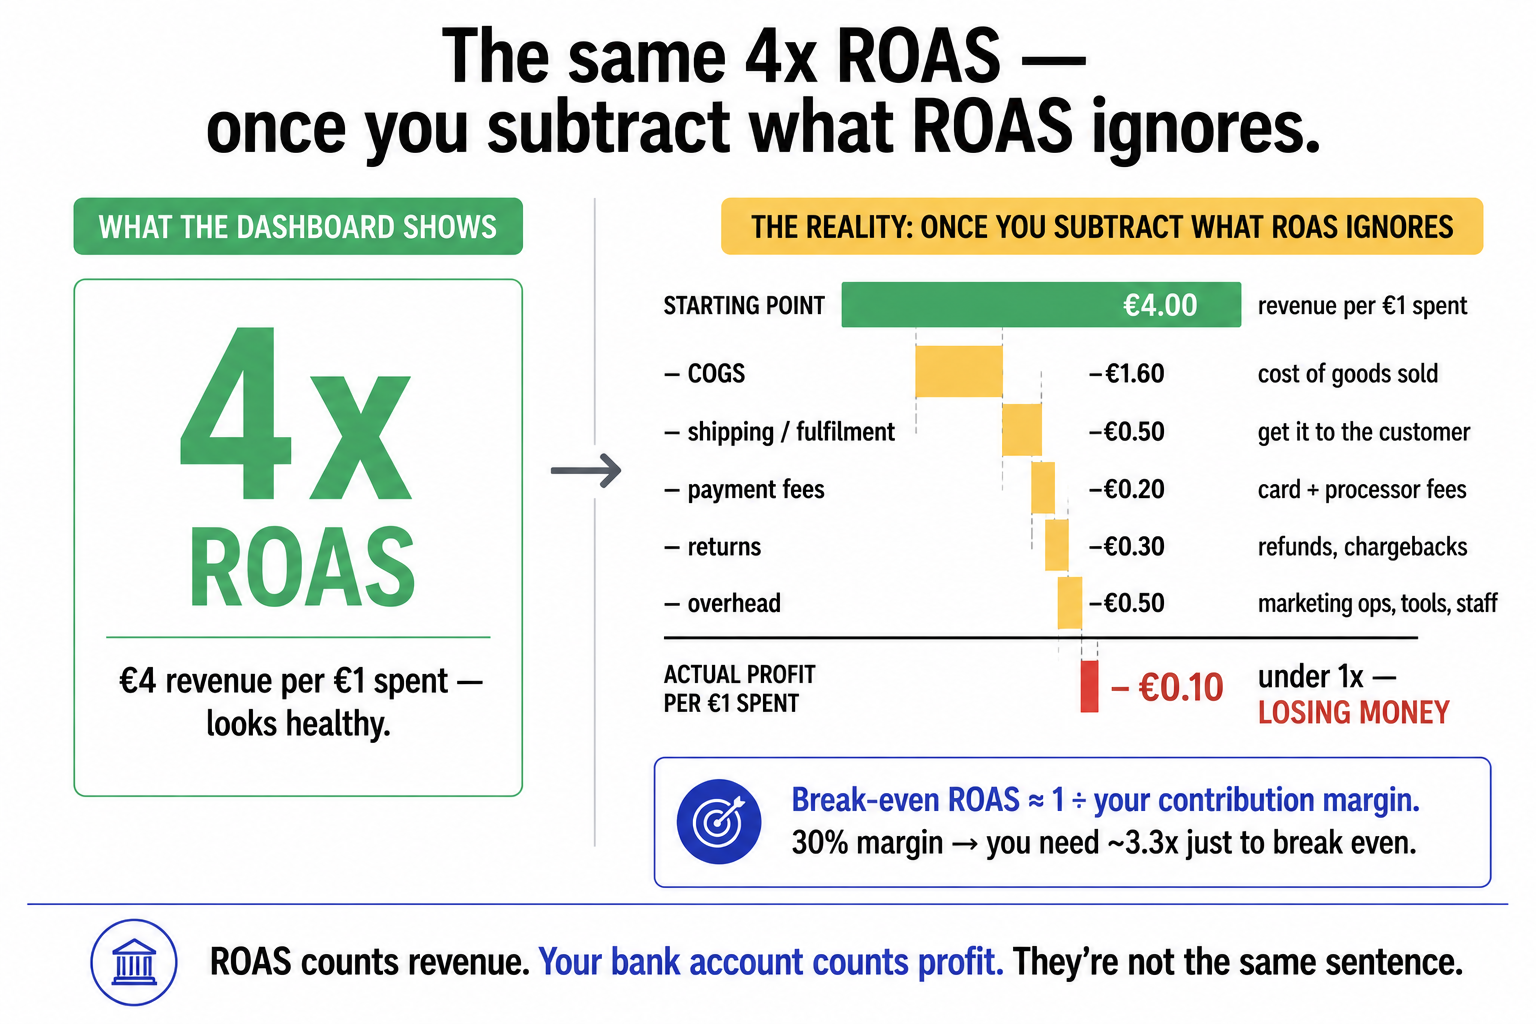
The first and most fundamental problem: ROAS treats all revenue as equal, even though your profit on it is not. The formula is revenue divided by ad spend. Notice what is missing, every cost between the sale and your bank account. Product cost (COGS), shipping and fulfilment, payment processing, returns, platform fees, overhead. ROAS counts the top-line revenue and ignores all of it.
That gap is not academic. Picture a 4x ROAS, four euros of revenue per euro of ad spend, which sounds healthy. Now subtract a realistic cost stack: maybe 38% goes to cost of goods, some percentage to a return rate, a few percent to payment fees, a slice to overhead. Run those numbers and that "healthy 4x" can collapse to a profit multiple well under 1, meaning you lose money on every euro spent. The ROAS dashboard stays green the whole time. This is why most stores have to calculate their break-even ROAS before they can read a ROAS number at all: it is roughly one divided by your contribution margin. If your true margin is 30%, your break-even ROAS is about 3.3x, anything below that loses money, and you need meaningfully more for actual profit. A store celebrating a 3x ROAS on 30% margins is celebrating a loss.
The fix at the metric level is straightforward and increasingly standard: POAS, profit on ad spend. Same idea as ROAS but with the costs subtracted first, profit divided by ad spend instead of revenue divided by ad spend. A POAS of 1.5 means €1.50 of actual profit per euro spent, which is a number that means something to your bank account. The difference between the two metrics is the difference between "this campaign generated sales" and "this campaign made money," and those are not the same sentence. ROAS measures the efficiency of your ads; POAS measures the health of your business.
Lie #2: ROAS assumes the sale wouldn't have happened anyway
The second lie is subtler and, in many ways, worse, because it survives even if you switch to POAS. ROAS (and POAS) assume the ad caused the sale. But a large share of the conversions a campaign claims would often have happened without it, most obviously when you retarget people who already intended to buy, or advertise to your existing customers, or bid on your own brand name. The customer searches for you, clicks your ad instead of the organic result right below it, and buys, and the ad takes full credit for a sale you would have got for free. That is not a 5x return. It is a 5x claim.
This is the incrementality problem, and it is the same lesson that runs through everything I have written about affiliate attribution: a channel that claims a sale is not the same as a channel that caused it. ROAS is built on the assumption that every tracked conversion is incremental, and in reality a meaningful chunk of it is recaptured demand the platform is taking credit for. The privacy era made this worse, not better: with user-level tracking degraded since the 2021 iOS changes, the platforms' own attribution increasingly over-claims, each one reporting conversions it may not have driven, so the ROAS figures in your Meta and Google dashboards are often inflated by the very systems being judged on them. Optimising hard toward those numbers means pouring budget into campaigns that look like they are working because they are efficiently harvesting demand that already existed. That caps your real growth while the dashboard glows.
The trap nobody warns you about: you're training the algorithm to hurt you
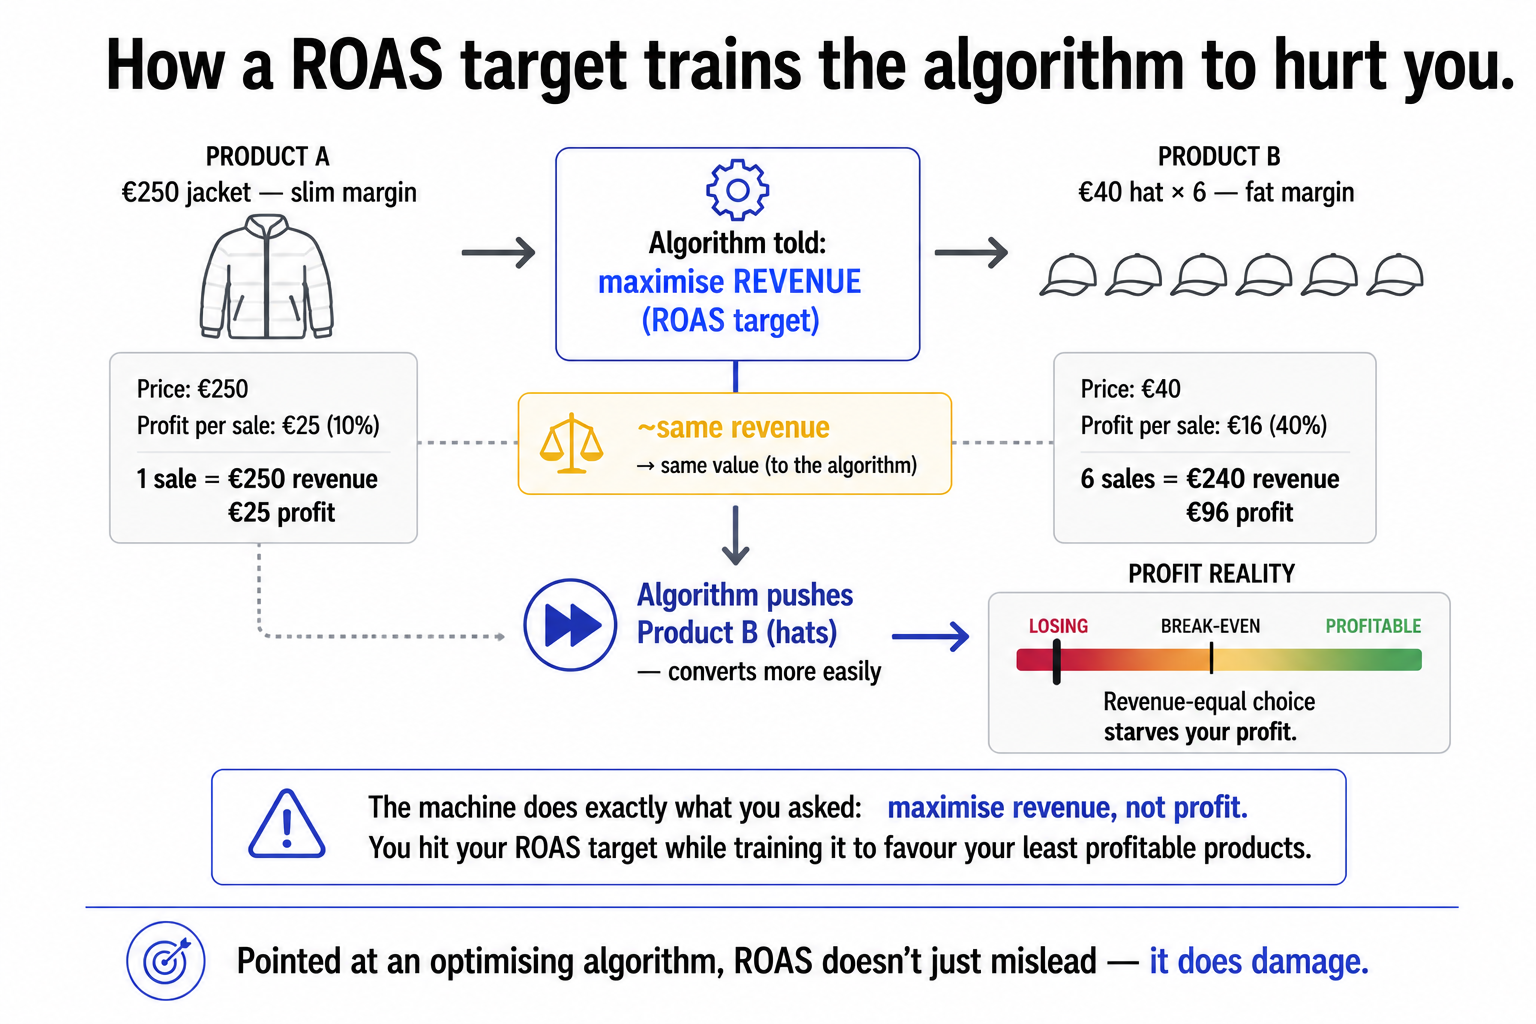
Here is the consequence that makes this more than an accounting argument, because the two lies combine into something genuinely damaging when you let an ad platform optimise toward ROAS. When you tell Google or Meta to maximise conversion value at a ROAS target, you are telling the machine to maximise revenue, and the machine does exactly that, with no idea which of your products actually make money.
Consider a store selling a €250 jacket at a slim margin and €40 hats at a fat one. To a revenue-maximising algorithm, one jacket sale and roughly six hat sales look like the same outcome, similar revenue. But because the cheaper, simpler product converts more easily, the system will often push the hats harder to hit your ROAS target, even if the hats contribute far less profit (or, after costs, none). The algorithm is doing precisely what you asked: maximise revenue, not profit. So you can "hit your ROAS target" while quietly training the platform to prioritise your least profitable products and starve your most profitable ones. The metric is not just measuring the wrong thing; pointed at an optimising algorithm, it actively steers the machine to erode your margin. That is the difference between a metric that is merely incomplete and one that does damage.
What to measure instead
None of this means throw ROAS away. It means demote it from verdict to input, and build your actual decisions on metrics that see what ROAS cannot. The honest stack, roughly in order:
- Know your break-even ROAS first. Before you read any ROAS number, calculate the floor (about one divided by your contribution margin). A ROAS figure is meaningless until you know the line between profit and loss for your margins. Share that break-even number with whoever runs your ads so they optimise toward profit-aware targets, not a generic "higher is better."
- Lead with POAS or contribution margin. Judge campaigns on profit after variable costs, not revenue. POAS (profit ÷ ad spend) or contribution-margin-after-ad-spend tells you what each campaign actually contributed to the business, which is the question that matters.
- Use MER for the honest blended picture. Because per-platform ROAS lets every channel claim the same sales and is inflated by platform over-attribution, MER (total revenue ÷ total marketing spend) gives you the blunt, harder-to-game view of whether your whole marketing engine is efficient. When per-campaign ROAS and blended MER disagree, trust MER.
- Track new-customer acquisition, not just conversions. Measure spend against genuinely new customers to cut through the incrementality problem, a campaign that mostly recaptures existing customers has a flattering ROAS and little real value. New-customer ROAS (or CAC against new customers only) gets you far closer to incremental truth.
- Where it matters, test incrementality directly. The only way to truly know what a channel added is to measure what happens when you turn it down or off (a holdout or geo test). It is more work, and it is the only thing that actually answers the question ROAS pretends to.
The pattern underneath all five: stop asking "how much revenue did the platform say this drove" and start asking "how much profit did this actually add to the business that would not have been there otherwise." That is a harder question. It is also the only one worth answering.
That is the case against ROAS as a scoreboard. It lies twice over, it counts revenue instead of profit, so it hides losses behind healthy-looking multiples, and it assumes causation it has not earned, so it claims credit for demand that already existed. Worst of all, handed to an optimising algorithm, it trains your ad platform to chase revenue over margin and quietly favour your least profitable products. The fix is not a better single number; it is a hierarchy, break-even ROAS as the floor, profit and contribution margin as the verdict, MER for the blended truth, new-customer focus and incrementality testing to cut through the attribution fog. Use ROAS to talk to the algorithms, because that is still the lever they take. But use profit to talk to your bank account, because that is the only conversation that decides whether the business survives. A green ROAS dashboard has bankrupted more brands than a red one ever has.
A few common questions
Why is ROAS misleading? ROAS (return on ad spend) is revenue divided by ad spend, so it measures revenue, not profit, it ignores cost of goods, shipping, fees, returns, and overhead. A high ROAS on thin-margin products can still lose money, because most stores need roughly a 3-4x ROAS just to break even once costs are subtracted. ROAS also assumes the ad caused the sale, so it over-credits campaigns that merely recapture demand that would have converted anyway (retargeting existing customers, brand-term bidding). It's not useless, but it's incomplete and easy to be fooled by.
What is POAS and how is it different from ROAS? POAS (profit on ad spend) is profit divided by ad spend, the same idea as ROAS but with all the costs (COGS, shipping, fees, returns) subtracted first. ROAS measures the efficiency of your ads (revenue per euro spent); POAS measures the health of your business (profit per euro spent). A POAS of 1.5 means €1.50 of actual profit per euro spent. POAS is the metric ROAS should be but isn't, because it reflects what actually reaches your bank account.
What is a break-even ROAS? Break-even ROAS is the ROAS at which a campaign exactly covers its costs, neither profit nor loss. It's roughly one divided by your contribution margin: with a 30% margin, your break-even ROAS is about 3.3x; with 25%, about 4x. This matters because a ROAS number is meaningless until you know your break-even line, a "great 3.5x ROAS" on 30% margins is actually losing money. Always calculate your break-even ROAS before judging any ROAS figure, and share it with whoever runs your ads.
If ROAS is so flawed, what should I measure instead? Demote ROAS from verdict to input and build decisions on metrics that see what it can't: calculate your break-even ROAS as a floor; lead with POAS or contribution margin (profit, not revenue); use MER (total revenue ÷ total marketing spend) for the blended, harder-to-game picture; track spend against genuinely new customers to cut through the incrementality problem; and where it matters, test incrementality directly with holdout or geo tests. The underlying shift is from "how much revenue did the platform claim" to "how much profit did this actually add that wouldn't have happened anyway."
You should also read:
Vanity Metrics vs Decision Metrics
A vanity metric is any number that makes you feel good without telling you what to do. A decision metric is a number that, when it moves, changes your next action. That is the entire distinction, and it is worth more than any list of…
Continue reading...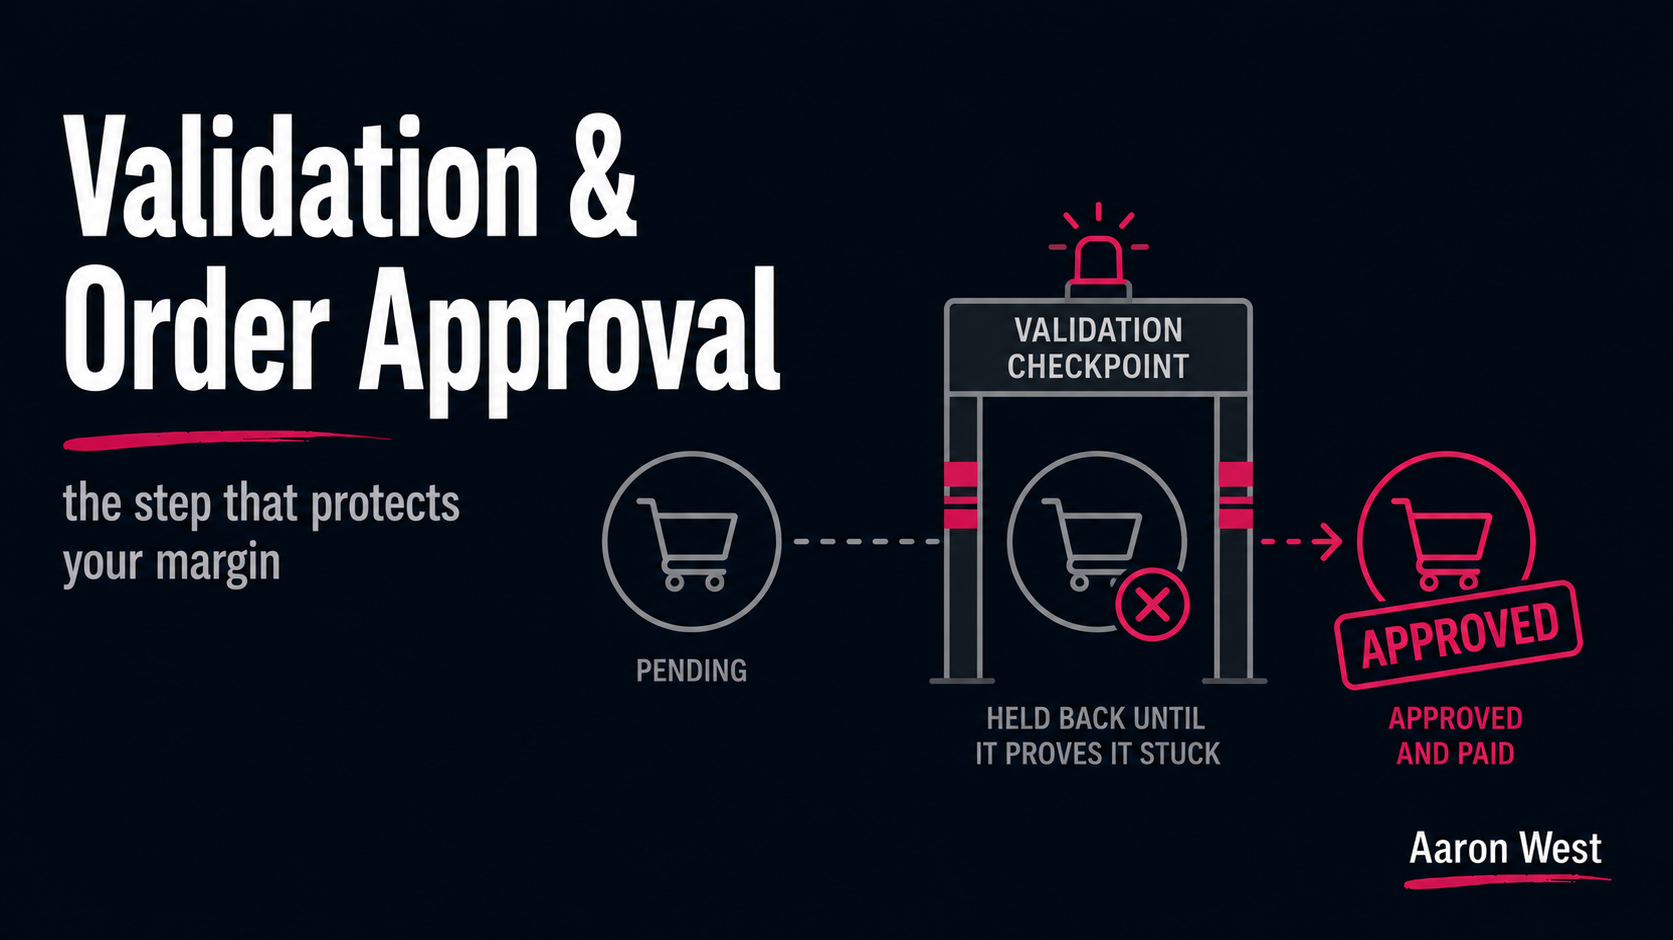
Validation and Order Approval: The Step That Protects Your Margin
Validation is the step where a merchant confirms a tracked affiliate sale is genuine, not returned, cancelled, or fraudulent, before the commission is approved and paid. It is the control that stops you paying for sales that never really stuck, and it works through a…
Continue reading...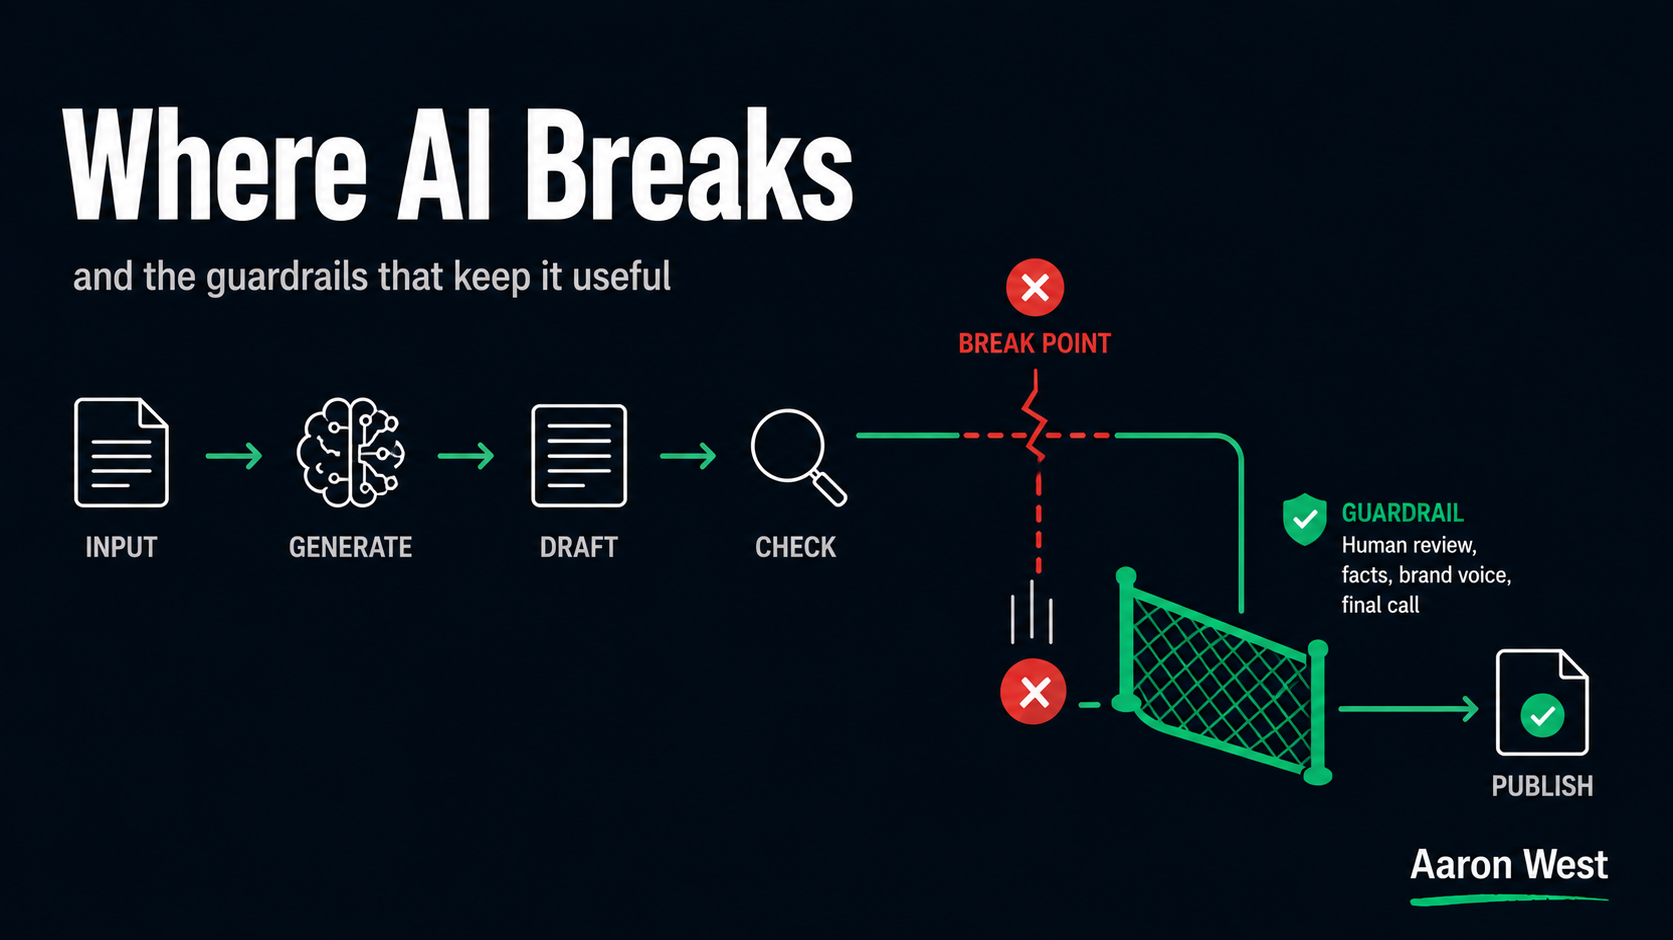
Where AI Breaks in E-Commerce Ops (and the Guardrails That Keep It Useful)
AI does not fail randomly in e-commerce operations. It fails in a handful of specific, predictable ways, and once you know them, you can build the guardrails that let you use AI confidently instead of nervously. The failures are not exotic. They are the same…
Continue reading...