The Performance Marketing Metrics Glossary: CPC, CPM, CPA, CPL, CPS, ROAS, AOV, LTV

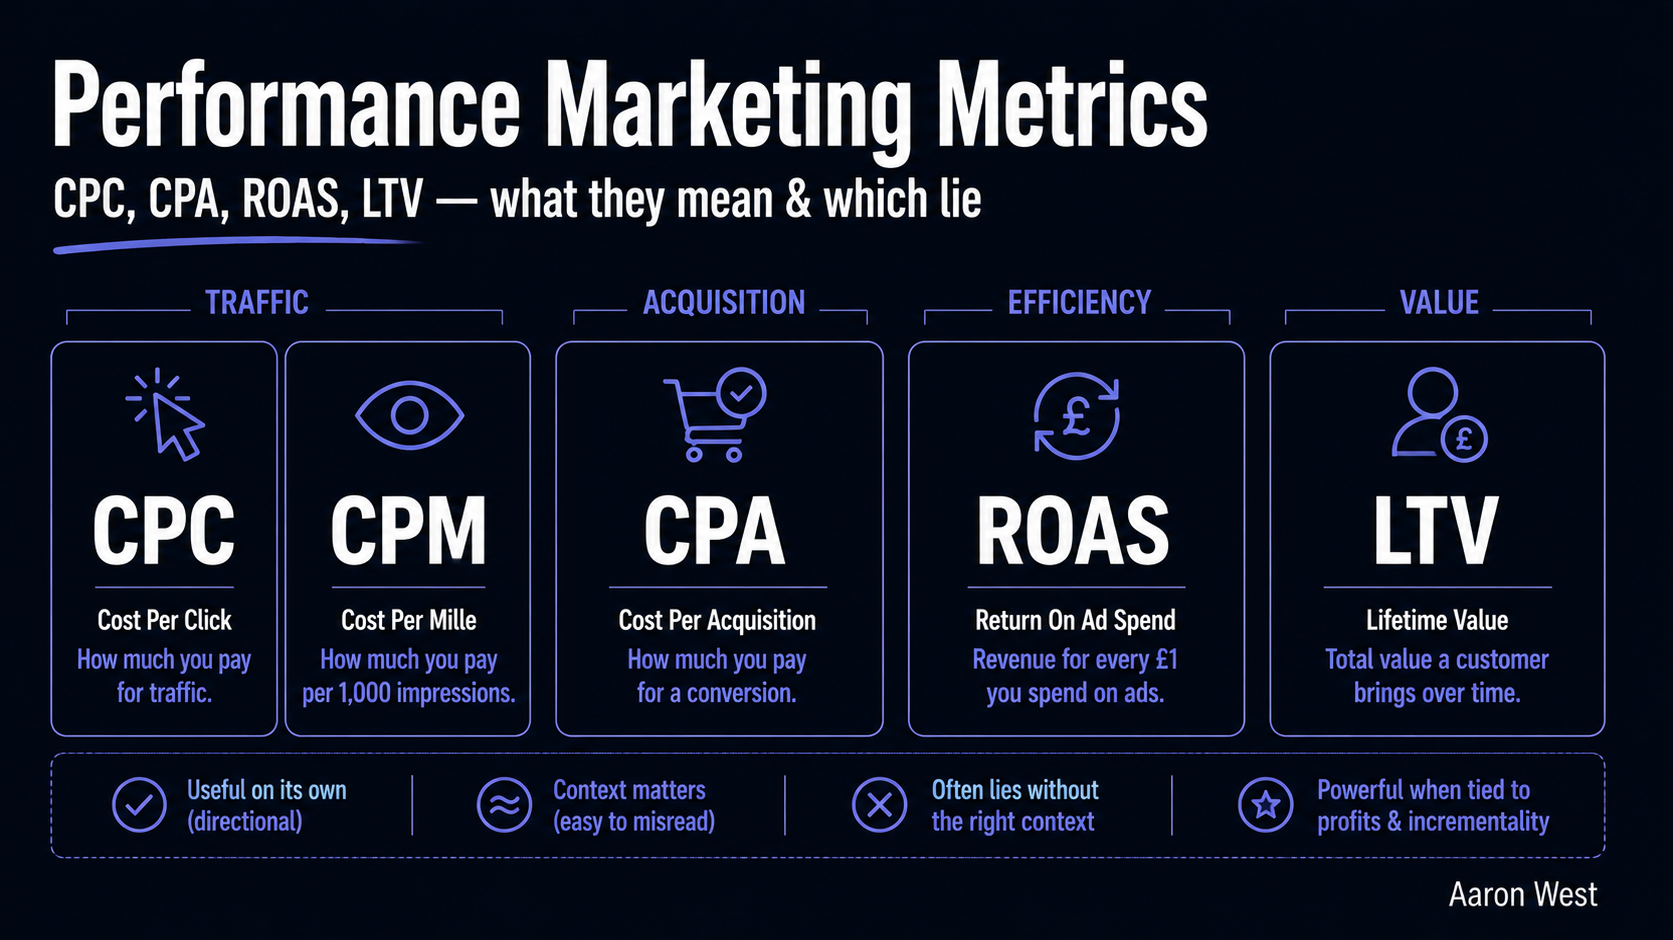
Table of Contents
Every performance marketing metric answers one of three questions: what does this cost, did it make money, or what is actually happening in between. Sort any acronym you meet into one of those three buckets and the alphabet soup stops being intimidating, CPC, CPM, and the cost-per family answer "what does it cost"; ROAS, MER, AOV, and LTV answer "did it make money"; CTR and conversion rate answer "what is happening in between." This glossary defines each one plainly, gives the formula, and (because a definition without a point of view is just a dictionary entry) tells you what each number is actually good for and where it misleads.
This is the reference companion to the performance marketing cornerstone. I have written it the way I wish glossaries were written: not as neutral definitions, but with the practitioner's note on which metrics tell the truth and which flatter you, because knowing the formula for ROAS is useless if you do not know that ROAS lies. Use it as a reference, skim to the metric you need, but read the practitioner notes, they are where the actual value is. No term is used before it is defined, and every formula is in plain arithmetic.
The cost-per family: what does an action cost?
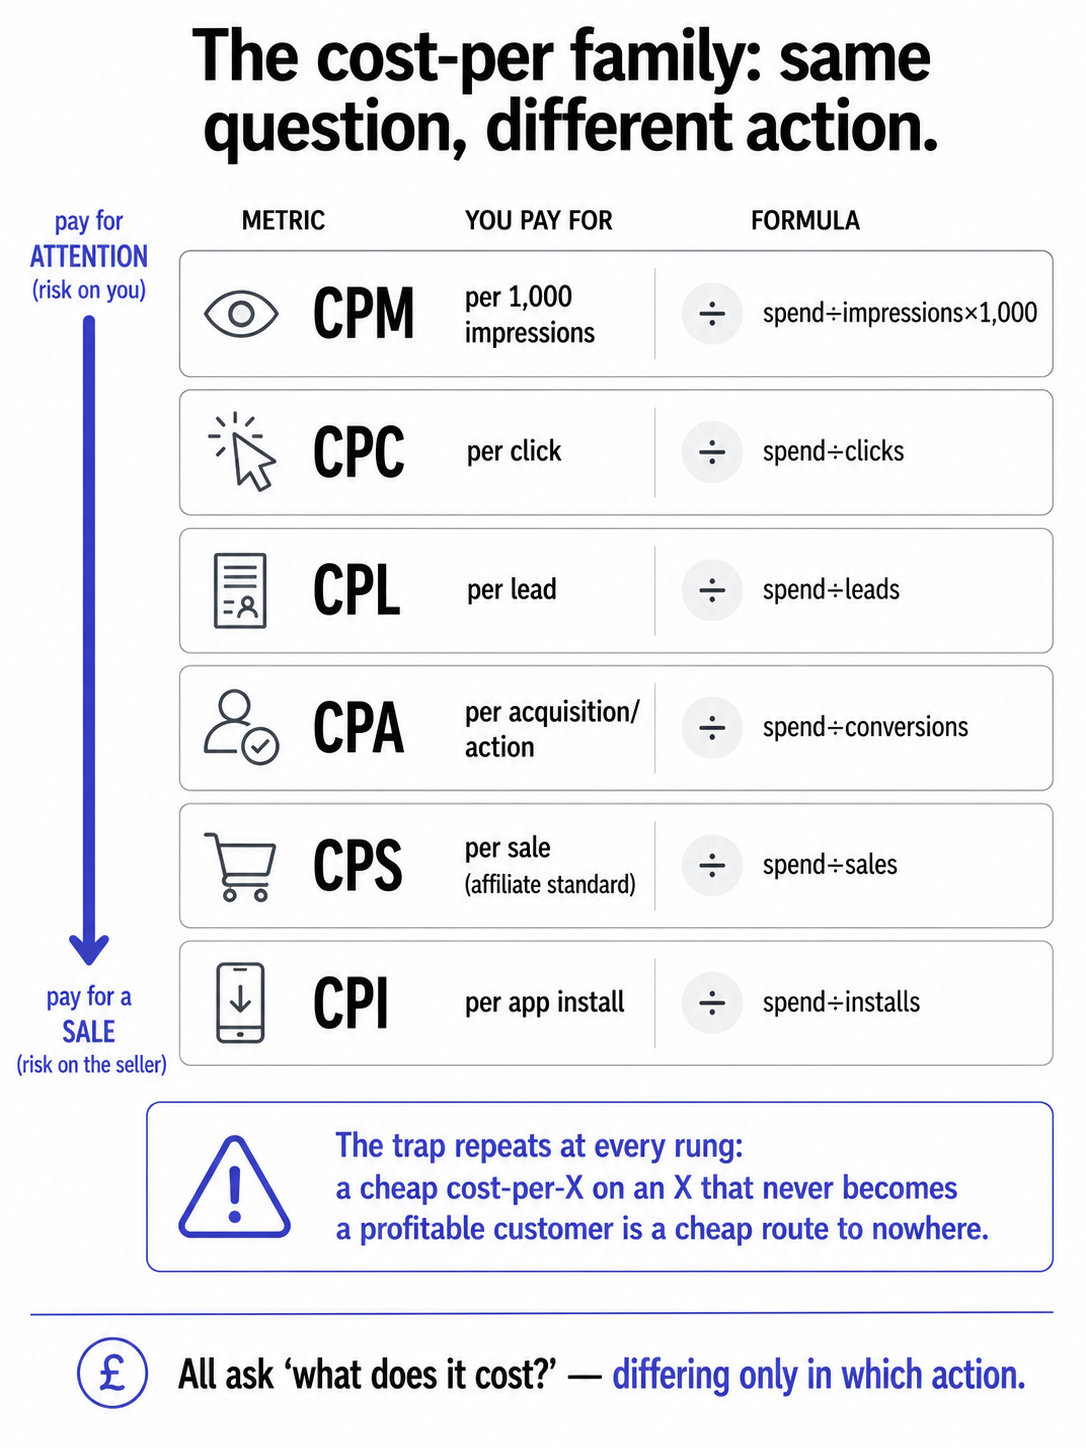
These all start with "cost per" and answer the same basic question, how much am I paying for a given action, differing only in which action. They sit on a ladder from paying for attention to paying for a sale.
CPM (Cost Per Mille / cost per thousand impressions). What you pay for every thousand times your ad is shown. Formula: (total spend ÷ impressions) × 1,000. An impression is one display of your ad, whether or not anyone notices it. CPM is the currency of awareness campaigns. Practitioner note: CPM tells you what visibility costs, nothing about whether it worked. A cheap CPM on an ad nobody acts on is just cheap noise.
CPC (Cost Per Click). What you pay each time someone clicks your ad. Formula: total spend ÷ clicks. Practitioner note: CPC is a useful efficiency input and a classic vanity trap. A low CPC feels like winning, but a click is not a customer, cheap clicks that never convert are the most common way to feel productive while losing money. Judge CPC alongside what those clicks do, never alone.
CPL (Cost Per Lead). What you pay for each lead, a sign-up, a form fill, an enquiry. Formula: total spend ÷ leads. It is really a type of CPA where the "action" is a lead rather than a sale. Common for higher-value or subscription products where the sale comes later. Practitioner note: a lead is a promise, not a payment. A low CPL on leads that never become customers is the same trap as cheap clicks, one step further down the funnel.
CPA (Cost Per Action / Acquisition). What you pay for a completed conversion, usually a purchase or a defined valuable action. Formula: total spend ÷ conversions. Practitioner note: this is where cost metrics start telling the truth, because you are paying for the thing you actually want. CPA is the workhorse efficiency metric. Its limit: it counts what a customer cost to acquire, not what they are worth, which is why it must be read against LTV (below).
CPS (Cost Per Sale). The affiliate-standard version of CPA, you pay (the partner) only when a sale completes. Formula: total spend ÷ sales (or simply the commission per sale). Practitioner note: the lowest-risk model for the advertiser, since you pay only on a confirmed sale, which is exactly why it is the backbone of affiliate commission.
CPI (Cost Per Install). The app-world CPA, what you pay per app install. Formula: total spend ÷ installs. Practitioner note: an install is the app version of a lead, not a customer. The install is the beginning, the metric that matters comes after (does the installer ever use or pay).
The thread through all of these: as you move down the family from CPM to CPS, you pay for something closer to actual value, and the risk shifts from you to the seller. And the trap repeats at every rung, a cheap cost-per-X on an X that does not lead to a paying, profitable customer is not efficiency. It is a cheap route to nowhere.
The profitability family: did it actually make money?
These answer the question the cost-per family cannot, was it worth it, and this is where the real decisions live. It is also where the most popular metric is the most misleading, so read the notes.
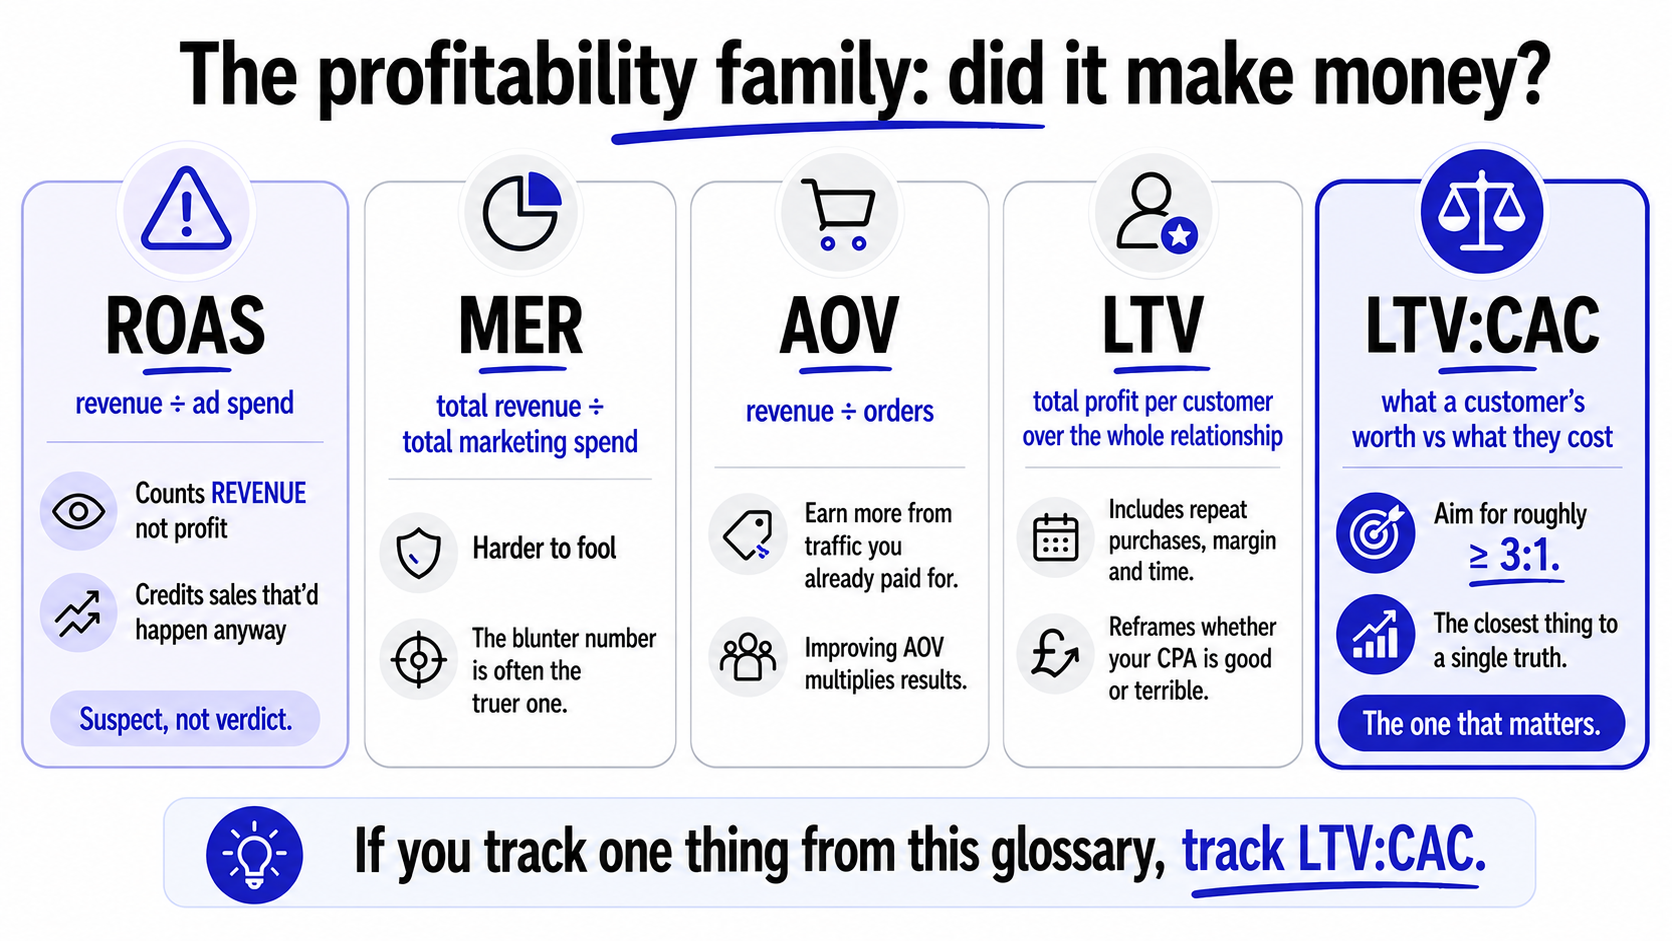
ROAS (Return On Ad Spend). Revenue generated per unit of ad spend. Formula: revenue from ads ÷ ad spend (e.g. €5,000 revenue ÷ €1,000 spend = 5x ROAS). Practitioner note, the most important in this glossary: ROAS is the metric everyone leads with and the one that lies most. Two reasons. First, it counts revenue, not profit, a 5x ROAS on a product with thin margins can still lose money. Second, it credits the ad with sales that might have happened anyway, if you advertise to people who would have bought regardless, ROAS claims a "return" that was never incremental. ROAS is not useless, but treat it as a suspect, not a verdict. (This matters enough that it gets its own piece.)
MER (Marketing Efficiency Ratio). Total revenue divided by total marketing spend. Formula: total revenue ÷ total marketing spend. Practitioner note: MER is ROAS's harder-to-fool cousin. Instead of letting each channel claim credit for the same sale in isolation (which inflates every channel's ROAS), MER looks at all your revenue against all your marketing spend. In a privacy era where channel-level attribution is increasingly unreliable, MER's blunt honesty, total in, total out, has made it more trusted than per-campaign ROAS. The blunter number is often the truer one.
AOV (Average Order Value). The average amount spent per order. Formula: total revenue ÷ number of orders. Practitioner note: AOV is quietly one of the most actionable numbers you have, because raising it (through bundling, upsells, thresholds) increases revenue with no extra acquisition cost, you are earning more from traffic you already paid for. It also sets the ceiling on what you can afford to pay to acquire a customer.
LTV (Customer Lifetime Value). The total profit a customer generates over their whole relationship with you, not just their first order. Practitioner note: LTV is the number that changes everything, because it reframes acquisition cost. A customer who costs €30 to acquire (CPA) but is worth €300 over their lifetime is a bargain; the same €30 CPA on a customer worth €31 is a disaster. You cannot judge whether your acquisition cost is "good" without LTV.
CAC (Customer Acquisition Cost) and the LTV:CAC ratio. CAC is the fully-loaded cost to acquire one customer (broader than CPA, it includes all the costs, not just media). The single most important ratio in the discipline is LTV:CAC, what a customer is worth versus what they cost. Practitioner note: the widely-used healthy benchmark is roughly LTV worth at least three times CAC. Below that, you are buying customers you cannot afford; well above it, you can usually afford to spend more to grow faster. If you track only one thing from this entire glossary, track this ratio. It is the closest thing performance marketing has to a single truth.
The in-between family: what's actually happening?
These do not measure cost or profit directly, they measure behaviour at each step, which is how you diagnose why the cost and profit numbers look the way they do.
Impression. One display of your ad. The raw count of how many times it was shown. Not a measure of attention, just of delivery.
CTR (Click-Through Rate). The percentage of people who click after seeing your ad. Formula: (clicks ÷ impressions) × 100. Practitioner note: CTR is your fastest read on whether your creative and targeting resonate, a low CTR usually means the message or audience is off. But high CTR with low conversion means you are attracting clicks you cannot convert, so CTR diagnoses the top of the funnel, never the bottom.
CVR (Conversion Rate). The percentage of clicks (or visits) that become a desired action. Formula: (conversions ÷ clicks) × 100. Practitioner note: CVR is where the money is made or lost after the click, it reflects how well your landing page, offer, and product match the promise of the ad. A campaign with a modest CTR but strong CVR usually beats a high-CTR campaign that fails to convert. The click gets them in the door; CVR is whether anything happens once they are inside.
RPM (Revenue Per Mille) and RPV (Revenue Per Visitor). Revenue per thousand impressions, and revenue per visitor, respectively. Practitioner note: these flip the cost-per metrics around to ask what each unit earns rather than costs, useful for publishers and for comparing the value of different traffic sources.
The point of this family: cost and profit metrics tell you whether something is working; the in-between metrics tell you where it is breaking. A high CPA is a symptom; a low CTR or a low CVR is often the cause. You diagnose with these.
How to actually use a glossary like this
A closing word, because a list of metrics is dangerous without a hierarchy, and the hierarchy is the real lesson. Most marketers drown in metrics and optimise the wrong ones, and the pattern is always the same: they optimise the easy, flattering numbers (CPC, CTR, ROAS) instead of the hard, true ones (LTV:CAC, incrementality, profit). The discipline is not tracking more metrics. It is knowing the hierarchy.
So the order I would put them in: profitability and the LTV:CAC ratio sit at the top, they are what actually determines whether the business grows. Below them, the in-between behavioural metrics (CTR, CVR) for diagnosing why profitability looks the way it does. And the cost-per family as inputs, necessary, but never the scoreboard. The metric most marketers optimise wrongly is ROAS, because it sits in the profitability bucket and looks like truth, while quietly counting revenue instead of profit and claiming credit it did not earn. Demote it. Lead with LTV:CAC and profit, diagnose with CTR and CVR, and treat the cost-per numbers as the inputs they are.
That is the whole glossary, and the whole point of it. The acronyms are not the hard part, the formulas fit on a postcard. The hard part is the hierarchy: which numbers tell the truth, which ones flatter, and never confusing a metric that is easy to measure with one that is true. Bookmark this for the definitions. But take the hierarchy with you, because that is the part that decides whether all this measurement makes you money or just makes you busy. For the deeper arguments, the cornerstone covers the discipline as a whole, and the dedicated ROAS piece explains exactly why the most popular metric deserves the most suspicion.
A few common questions
What's the difference between CPC, CPM, and CPA? They're all "cost per" metrics differing in which action you pay for. CPM (cost per mille) is what you pay per thousand ad impressions (displays), the currency of awareness. CPC (cost per click) is what you pay per click. CPA (cost per action/acquisition) is what you pay per completed conversion, usually a sale or sign-up. As you move from CPM to CPA you pay for something closer to actual value, and the risk shifts from you to the platform, so CPA-style models cost more per unit. The formulas: CPM = spend ÷ impressions × 1,000; CPC = spend ÷ clicks; CPA = spend ÷ conversions.
What is ROAS and why is it misleading? ROAS (return on ad spend) is revenue divided by ad spend, e.g. €5,000 revenue from €1,000 spend is 5x ROAS. It's misleading for two reasons: it counts revenue, not profit (a high ROAS on thin-margin products can still lose money), and it credits the ad with sales that might have happened anyway (so it claims "returns" that weren't actually caused by the spend). Treat ROAS as a suspect, not a verdict, and lead with profit and incrementality instead. MER (total revenue ÷ total marketing spend) is harder to fool.
What is the LTV:CAC ratio and what's a good number? LTV:CAC compares what a customer is worth over their whole relationship with you (lifetime value) against what they cost to acquire (customer acquisition cost). It's the single most important ratio in performance marketing, because it tells you whether your acquisition is sustainable. The widely-used healthy benchmark is roughly LTV worth at least three times CAC; below that you're buying customers you can't afford, well above it you can usually afford to spend more to grow. If you track one thing, track this.
What's the difference between CTR and conversion rate? CTR (click-through rate) is the percentage of people who click after seeing your ad, clicks ÷ impressions × 100. Conversion rate (CVR) is the percentage of clicks (or visits) that become a desired action, conversions ÷ clicks × 100. CTR diagnoses the top of the funnel (is your creative and targeting resonating), CVR diagnoses the bottom (does your landing page, offer, and product deliver on the ad's promise). A modest CTR with strong CVR usually beats a high CTR that fails to convert, getting clicks is worthless if nothing happens after the click.
You should also read:
The Marketing KPI Dashboard: What to Actually Put On It
A good marketing dashboard is not the one with the most numbers on it. It is the one that answers a single question fast: what should I do next? Most dashboards fail this test. They are crowded with every metric the tools can produce, impressions,…
Continue reading...
The Affiliate Marketing Glossary: Every Term, in Plain English
Affiliate marketing is full of acronyms and jargon, CPS, EPC, S2S, dedup, postback, cookie window, that can make a simple channel sound impenetrable. This glossary defines the terms that actually matter, in plain English, grouped so you can see how they fit together. Each definition…
Continue reading...
Affiliate Commission Models: CPS, CPA, CPL, Hybrid and How to Choose
An affiliate commission model is simply the rule for what you pay a partner and when, and the main ones are CPS (a cut of each sale), CPA (a fixed fee for a defined action), CPL (a fee per qualified lead), and various hybrids and…
Continue reading...