Retention Metrics That Actually Predict Growth

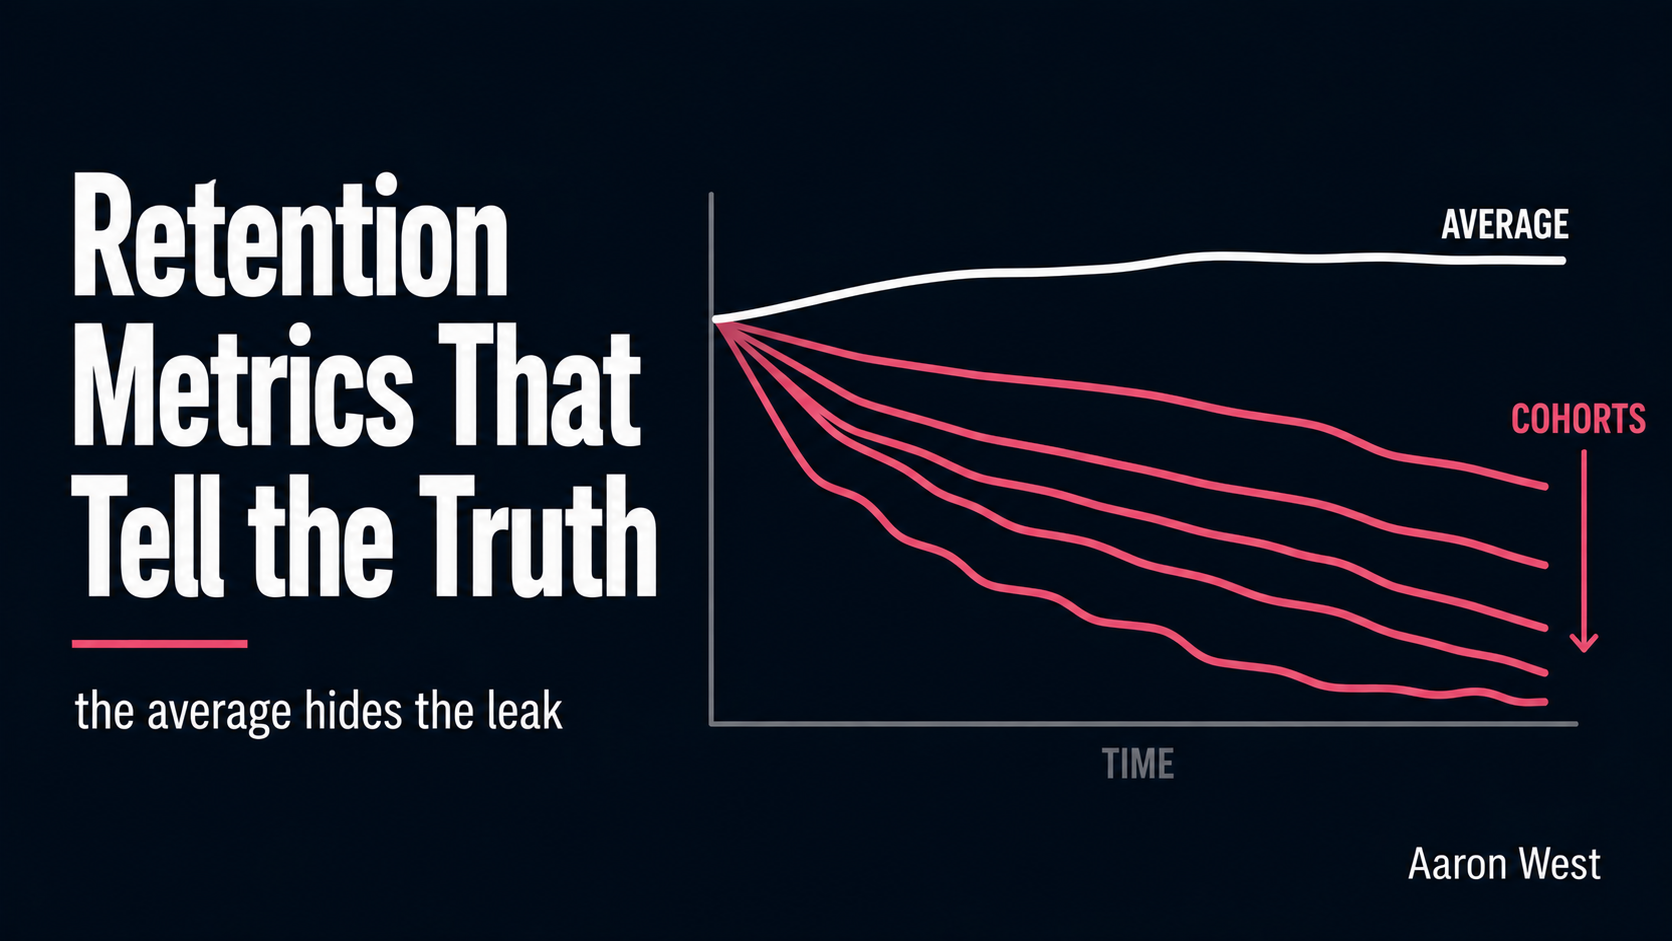
Table of Contents
The cornerstone of this pillar ended on a deceptively simple instruction: do the work consistently, and measure it. This is the reference for that last word. Retention has a long list of possible metrics, and most teams fall into one of two traps with them: they track none at all, so retention is a vague gut feeling that nobody can defend, or they track a flattering version that makes the dashboard look healthy while the actual base quietly erodes. The goal here is the short list that tells the truth, what each number actually means, which ones change decisions, and the one view that catches trouble months before the headline numbers admit it.
This is a reference piece, so I will keep it tight and practical. It connects back across the pillar: the metrics here are how you know whether your lifecycle automation, your reactivation, and your restraint with the inbox are actually working.
The core few, in plain terms
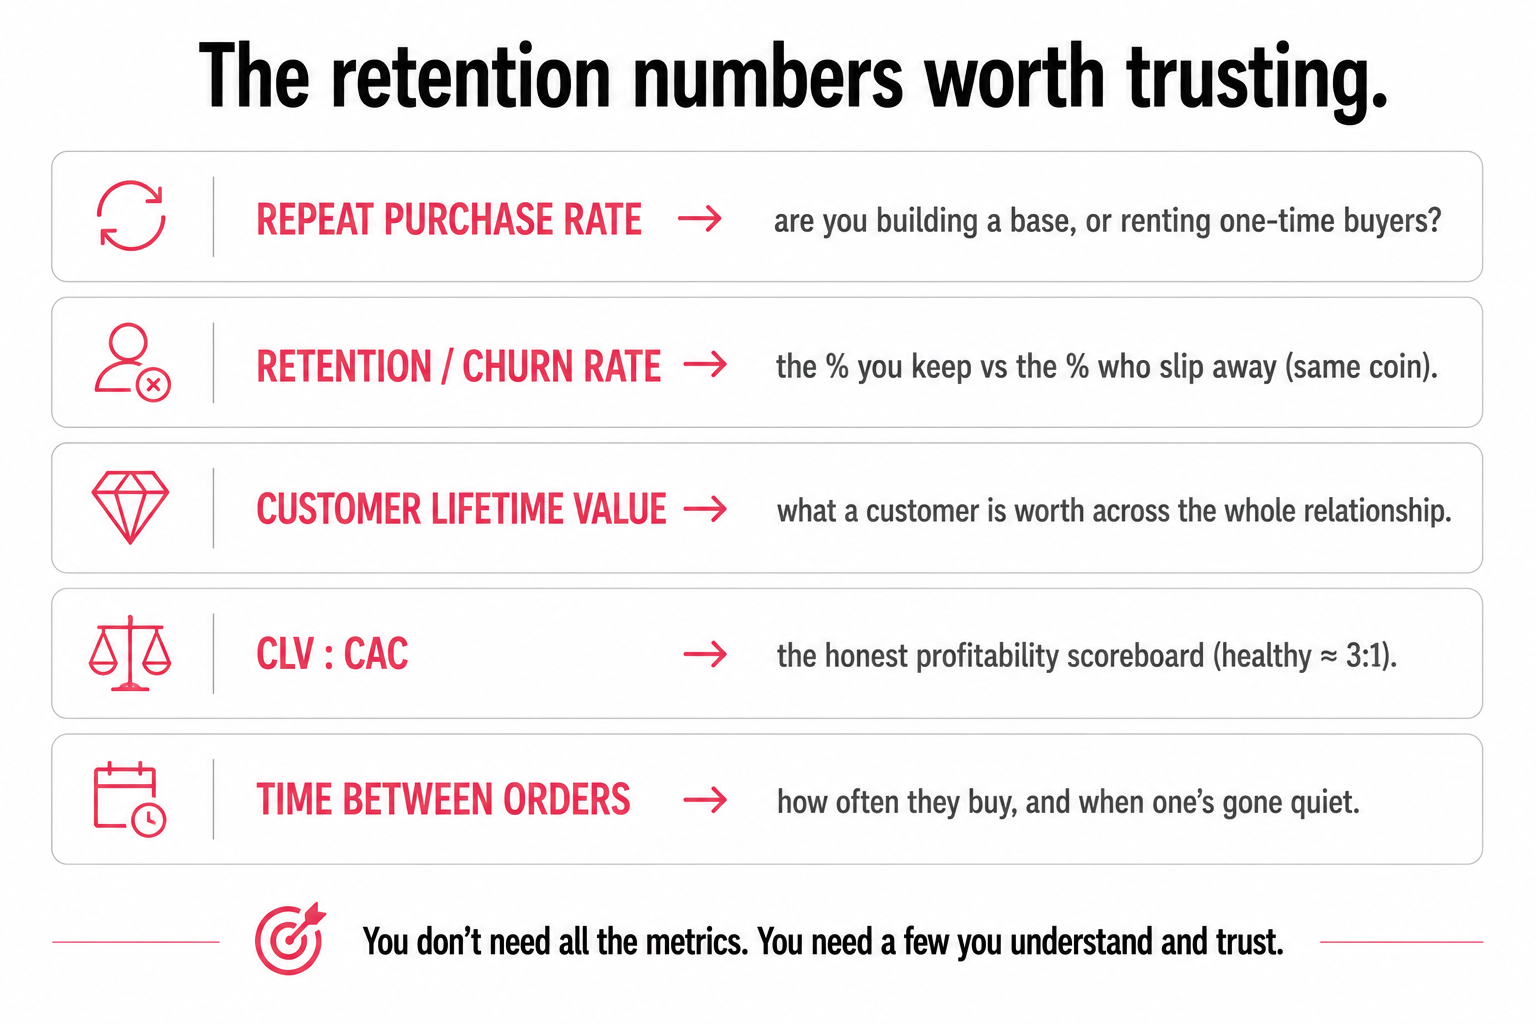
You do not need all of them. You need a handful you understand and trust:
- Repeat purchase rate (and its close cousin, loyal customer rate): the share of your customers who buy more than once. This is the simplest, most honest pulse of whether you are building a base or just renting one-time buyers from your ad budget. If this number is low, nothing else in retention matters yet, because you do not have retention to measure.
- Retention rate and churn rate: two sides of the same coin. Retention rate is the percentage of customers you keep over a period, churn rate is the percentage who slip away. Watch whichever frames the problem more usefully for you, but know they are the same information.
- Customer lifetime value (CLV): what a customer is worth across the whole relationship, not just on the first order. Roughly, it is the average value of a purchase times how often they buy times how long they stay. CLV is the number that reframes everything, because it tells you what a retained customer is actually worth, which in turn tells you what you can sensibly afford to spend acquiring and keeping one.
- CLV against acquisition cost (the LTV:CAC ratio): CLV set against what it costs you to acquire a customer. This is the honest profitability scoreboard, and a commonly cited healthy target is somewhere around three to one, you want a customer to be worth a comfortable multiple of what you paid to get them. A ratio near one to one means you are running hard just to break even.
- Purchase frequency and time between orders: how often customers buy, and the typical gap between purchases. Useful on its own, and the foundation for spotting when a regular customer has gone quiet, the lapsing signal your win-back depends on.
That is the core. Understood honestly, these tell you most of what you need to know.
The one view that tells the truth: cohorts
Here is the single most important thing in this whole piece, and it is the difference between a number that reassures you and a number that warns you in time: look at retention by cohort, not as one blended average. A cohort is simply a group of customers bucketed by when they first bought from you, everyone whose first order was in January, everyone whose first order was in February, and so on. You then track how each group's repeat behaviour holds up over the months that follow.
Why this matters so much is best shown by the most dangerous pattern in all of retention, the one a blended average completely hides. Imagine your headline repeat purchase rate looks healthy and stable. Reassuring. But underneath, it is being propped up by a loyal legacy base, customers you won years ago who keep buying, while your newest customers are leaking away faster every month. The blended number stays fine because the loyal old guard masks the failing new cohorts, right up until the legacy base ages out and there is nothing underneath it. Then the floor drops, suddenly, and seemingly without warning, except the warning was there for months in the cohort view, which would have shown each new group retaining worse than the last while the headline number smiled back at you. If you measure one thing properly in retention, measure it by cohort. The blended average is where leaks go to hide.
Which numbers change what you do
A quick filter borrowed from how I think about metrics generally: the test of a metric is whether it would actually change a decision. By that test, repeat purchase rate by cohort and CLV against CAC are decision metrics, they tell you to go fix onboarding for new customers, or that you can afford to spend more acquiring them, or that you cannot. A raw count of "total customers ever," or even a blended retention rate, can quietly become a vanity metric when it hides the cohort story underneath. Track the numbers that move your hand, not the ones that simply make the quarter look good.
One more worth singling out, because it is a leading indicator rather than a lagging one: time to second purchase. Customers who come back for a second order quickly are far more likely to become long-term, loyal customers than those who take a long time, or never return. This is exactly why the second-purchase nudge is the highest-leverage motion in your lifecycle, and measuring time-to-second-purchase directly gives you an early read on future retention rather than waiting months to discover it in the churn numbers. Most retention metrics tell you what already happened. This one hints at what is coming.
Three numbers, measured honestly
The reference-piece discipline is to resist tracking everything, because a dashboard with thirty retention metrics is just a different way of measuring nothing. Start with three: repeat purchase rate, CLV against acquisition cost, and retention by cohort. Those three, measured honestly and looked at regularly, tell you whether the discipline this entire pillar describes is actually working, whether you are building a base that compounds over time, or running a leaky bucket you keep refilling with expensive new customers who do not stay.
And hold onto the obvious but easily forgotten point: the numbers do not build retention. They tell you the truth about whether your retention is being built, and they tell it early enough to act, if you choose the few that do not lie to you. That is the cornerstone's closing instruction, "measure it," made concrete: not a wall of dashboards, but a small set of honest numbers, watched by cohort, that turn retention from a gut feeling into something you can actually manage.
A few common questions
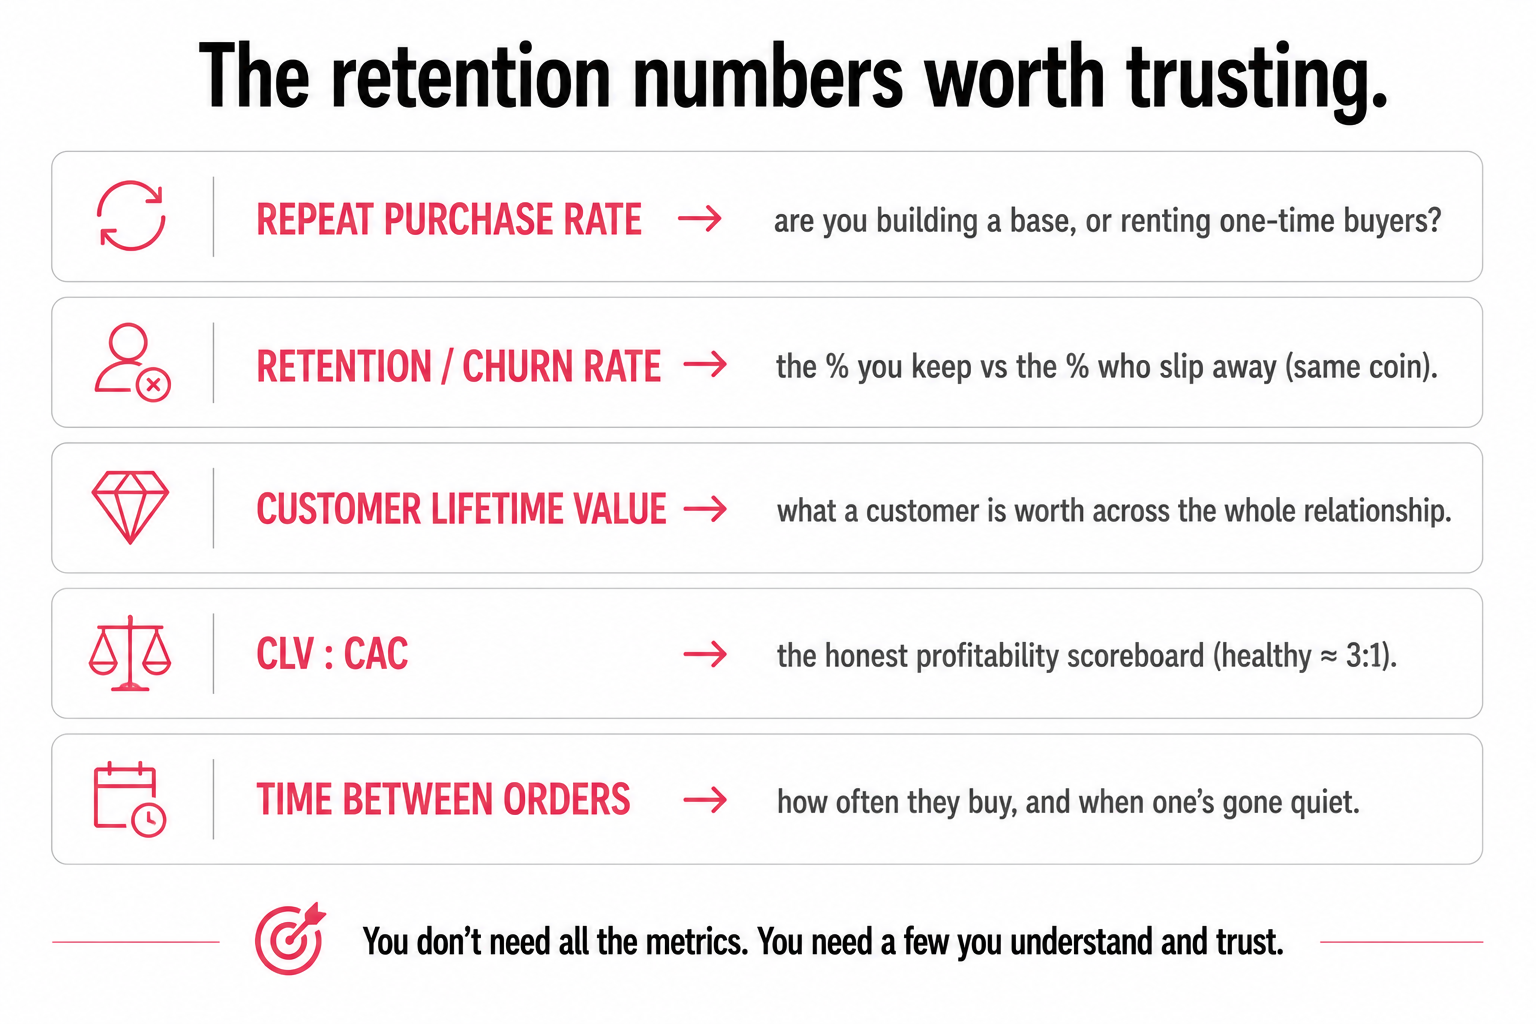
What are the most important retention metrics to track? Start with a handful you understand and trust rather than a wall of dashboards: repeat purchase rate (the share of customers who buy more than once, your simplest honest pulse), retention rate and churn rate (two sides of the same coin, the percentage you keep versus the percentage who slip away), customer lifetime value (what a customer is worth across the whole relationship), CLV against acquisition cost (the honest profitability scoreboard, with a commonly cited healthy target around three to one), and time between orders (how often customers buy, and the signal that one's gone quiet). If you track only three, make them repeat purchase rate, CLV against CAC, and retention by cohort.
Why measure retention by cohort instead of one overall number? Because a blended average hides the most dangerous pattern in retention. Your headline repeat purchase rate can look healthy and stable while it's being propped up by a loyal legacy base, even as your newest customers leak away faster every month. The blended number stays fine right up until that old guard ages out and the floor drops, seemingly without warning, except the warning was visible for months in the cohort view, which shows each new group retaining worse than the last. A cohort is just customers grouped by when they first bought; tracking each group over time catches a developing leak months before the overall number admits it.
What's a good CLV to CAC ratio? A commonly cited healthy target is somewhere around three to one, you want a customer to be worth a comfortable multiple of what you paid to acquire them. A ratio near one to one means you're running hard just to break even on each customer, which is fragile. The exact target varies by business and margin structure, so treat three to one as a directional benchmark rather than a hard rule, the real point is to track CLV against CAC at all, since most teams obsess over acquisition cost while never calculating what a retained customer is actually worth.
Which retention metric predicts future growth earliest? Time to second purchase. Most retention metrics are lagging, they tell you what already happened. Time-to-second-purchase is a leading indicator: customers who come back for a second order quickly are far more likely to become long-term loyal customers than those who take a long time or never return. That's why the second-purchase nudge is the highest-leverage motion in a lifecycle, and measuring how fast customers reach their second order gives you an early read on future retention instead of waiting months to find it in the churn numbers.
You should also read:
The Engagement Trap: Why "More Emails" Is Not a Retention Strategy
When retention numbers are soft, the most common reflex in the building is also the most damaging: send more emails. More newsletters, more promotions, more "we miss you" nudges, on the theory that more contact means more engagement means more sales. It is intuitive, it…
Continue reading...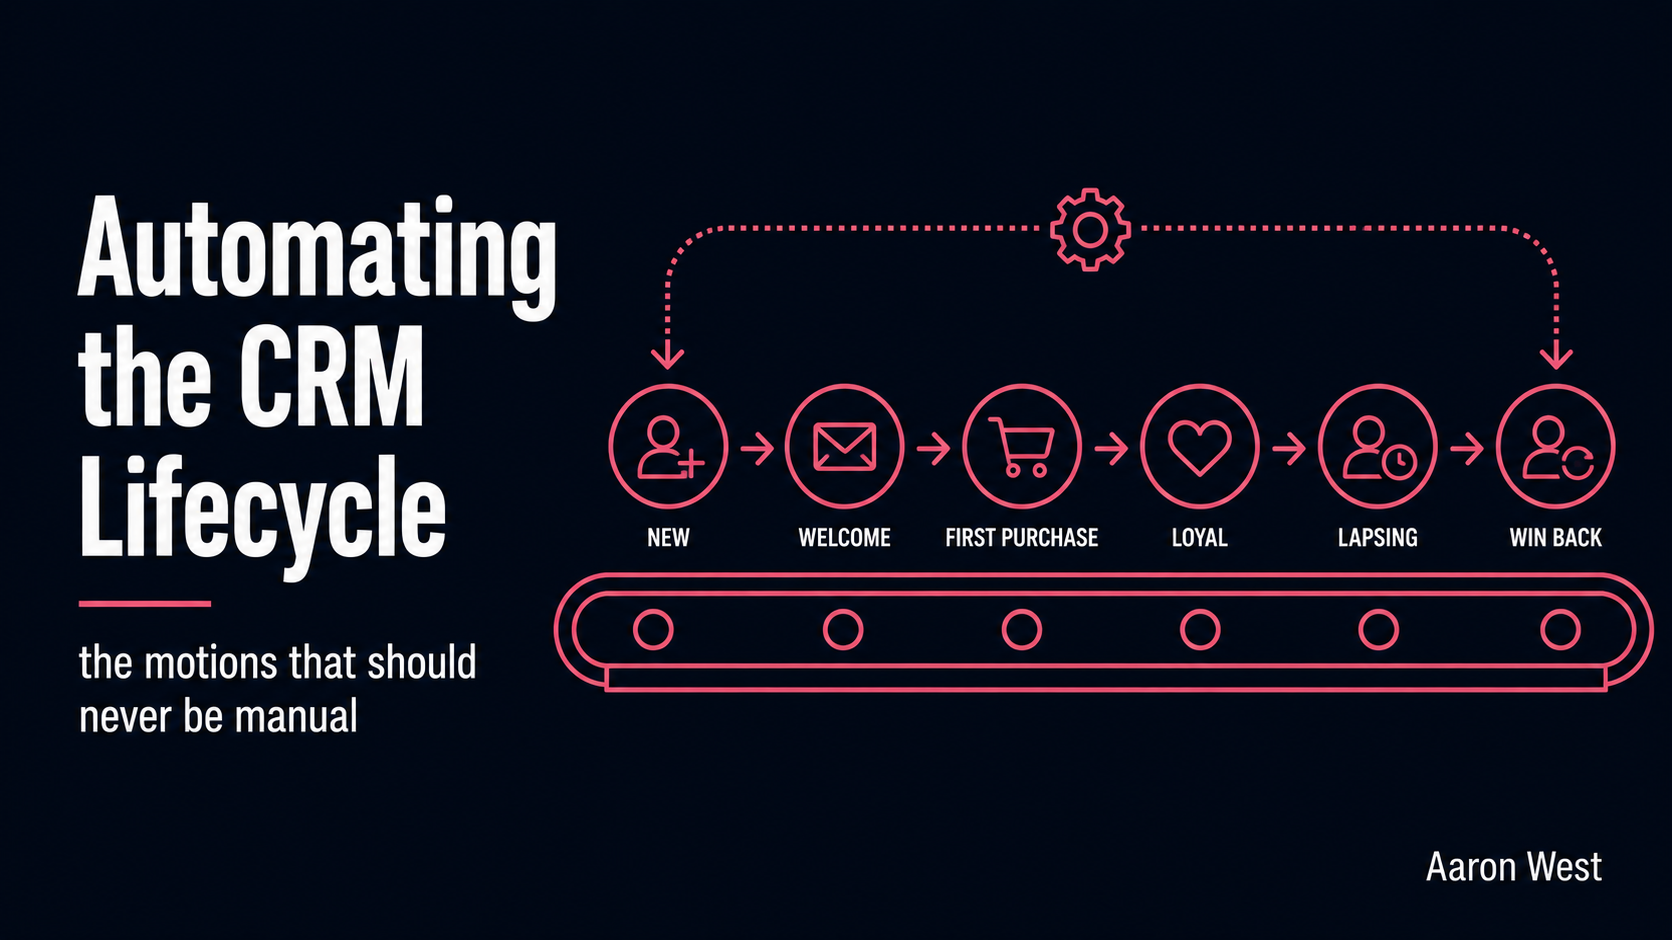
Automating the CRM Lifecycle: The Customer Motions That Should Never Be Manual
The cornerstone of this pillar made one demand that quietly does most of the work: decide what should happen next for each kind of customer, and then do it consistently. That word, consistently, is where almost every retention effort falls apart. The welcome that goes…
Continue reading...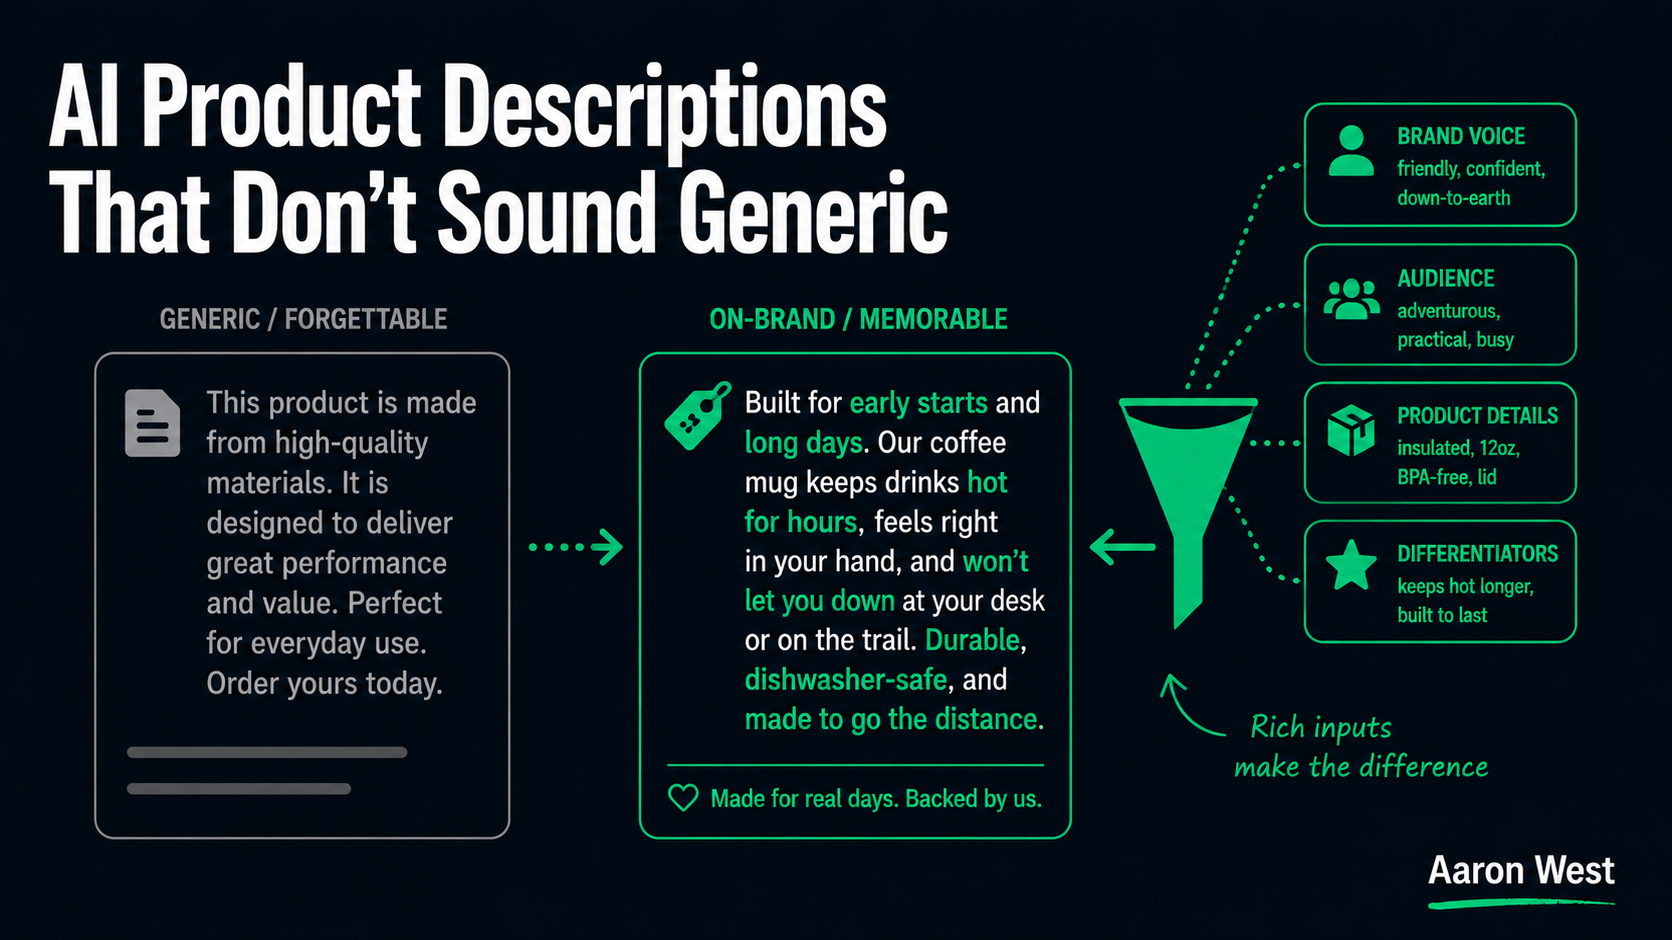
AI for Product Descriptions That Don't Sound Generic
The most common complaint about AI-written product descriptions is that they all sound the same, bland, interchangeable, like they could describe any product from any store. The complaint is fair, and here is the part nobody selling AI tools wants to say plainly: when AI…
Continue reading...